
Have you ever wondered what aggregate demand is? It focuses on the total demand for finished goods/services produced within an economy, calculated in local currency. If expressed in graphic form, the x-axis reflects demand or real GDP and the y-axis reflects price. While some would suggest aggregate demand is just a formula expressing supply and demand this is oversimplifying the calculation. The curve includes a whole range of different determinants to consider. Taking into account assumed economic performance going forward it is also possible to superimpose additional aggregate demand curves. These show the potential impact of varying degrees of economic growth or contraction.
Those who haven’t looked at the aggregate demand curve in detail might assume it is simply a straight line. They believe, as the average price comes down, demand increases. This assumes a whole array of different factors will remain constant,which they don’t. In reality, matters such as consumer spending, private investment, government spending and exports will often move in different directions to varying degrees. These are the more prominent elements which make up the aggregate demand curve formula. It is unlikely they will ever move in the same direction to the same degree at any one time. This subject offers a very interesting background for traders looking to incorporate demand for goods/services into their investment strategies. It also prompts a number of frequently asked questions which we will cover at the end of this article.
Table of Contents:
- What is aggregate demand?
- What Affects it?
- Interest Rates, Inflation & Other Determinants
- Components of Aggregate Demand
- Aggregate Demand Formula
- Frequently Asked Questions

What is Aggregate Demand?
The definition of aggregate demand is fairly simple. It’s an economic measurement that reflects total demand for all finished goods/services produced in an economy, in local currency. There is a direct correlation between aggregate demand and Gross Domestic Product (GDP). The latter reflects the total amount of goods/services produced in an economy, in the local currency, adjusted for inflation. Changes in interest rates, consumer demand and other factors will shift the curve to the left or to the right. There is an ongoing argument amongst economists as to whether an increase in consumer demand prompts an increase in production. It could also be that an increase in production prompts an increase in demand. Which came first, the chicken or the egg?

You may also like:
What Affects It?
Changes in aggregate demand are not caused by a change in the price of individual products/services. It’s more of a shift in economic activity. For example, in recessionary times we tend to see a reduction in consumer spending. It’s also accompanied by an increase in savings and a reduction in debt levels. This prompts a downward shift in the aggregate demand curve. As a consequence, demand for products/services will fall. In response, the need to save costs can potentially lead to large numbers of lay-offs. Large scale unemployment can prompt another fall in consumer demand, creating something of a vicious circle. This is why we tend to see an increase in government spending and tax breaks in recessionary times. It’s meant to compensate for the reduction in other determinants of aggregate demand.
In buoyant economies there is a reduced requirement for government investment. Tax breaks and growing wages feed into growing consumer demand, as well as an upshift in general demand for goods/services. Growing demand for goods/services tends to result in specific upward pricing pressure. A growing economy often leads to higher than average wage increases. When that happens, it prompts an increase in overall business costs. The resulting higher inflation puts further upward pressure on elements such as material costs. As mentioned above, there is often a lag between the increase in the cost of goods/services to consumers and the cost to business.
Interest Rates, Inflation & Other Determinants
It can be tempting to directly associate a graph showing the aggregate demand curve with a simple supply/demand formula for an individual product/service. In this scenario the assumption is that the price of all goods/services remains constant as does the income/expenditure of consumers. When looking at aggregate demand and its various determinants, we need to take into account a whole range of other factors. If for example we look at interest rates, they can have a huge impact on business costs and consumer demand. If interest rates increase, this will push the cost of business borrowing/consumer loans higher, prompting reduced demand. A reduction in interest rates will have the opposite effect. It reduces the cost of borrowing, encouraging business investment and boosting overall consumer demand.
There is an undeniable direct correlation between changes in interest rates, and the cost of business borrowing/consumer credit. It is worth noting, that speculation also heavily influences it. For example, in a buoyant economy many consumers (and businesses) may assume inflation will strengthen going forward. Determining prices based on that premise could result in higher costs of goods for both businesses and the consumer. This may impact short-term demand and lead to a rise in aggregate demand. Conversely, in light of the coronavirus pandemic, there may be an assumption that economic activity would reduce and prices will fall in real terms. This scenario would prompt a reduction in aggregate demand and shift the curve left.
Aside from interest rates and inflation, as covered above, there are other leading factors to consider such as:
Household Wealth
When looking at economic data you will often come across average household wealth and disposable income. An increase in household wealth will have a positive impact on aggregate demand. Mainly because of greater confidence in the economy, high levels of disposable income and more willingness to take on consumer debt. When household wealth declines we will experience a reduction in consumer debt. This is due to an increase in consumer savings and a delay/postponement in acquiring certain types of goods/services. This has a detrimental impact on the aggregate demand curve.
Government Expenditure
You will notice that governments tend to inject greater levels of capital into the economy in more challenging times. This could take the shape of increased investment in housing, reduction in business rates, VAT or even income tax. The idea is simple, when you reduce living expenses/business costs, you help build consumer disposable income. Doing so reduces the downward impact on aggregate demand. Consequently, in more buoyant economic times governments tend to refrain from tax giveaways and huge investments. The reason being, it could create an overheating economy – a consumer bubble ready to burst.
Foreign Exchange rates
Currencies very rarely move in the same direction. As a consequence, the cost of goods to foreign buyers tends to be fairly volatile across different settings. The formula for calculating aggregate demand does take net exports into account. Therefore, changes in the value of foreign currencies can have an impact on the aggregate demand curve. If for example, the British pound weakened against the dollar, then US consumers would be more attracted to UK imports. On the flipside, if the pound strengthens against the dollar, that would make US imports more attractive to UK buyers. In many ways this aspect of demand is heavily dependent on outside influences beyond the scope of domestic governments.
Cost of Materials
Moving on from the currency exchange rates, let’s talk about imports. Many businesses rely on the import of materials (or even employees) to enable them to provide products/services. For example, the cost of oil is traditionally quoted in US dollars. Therefore, any movement in the pound-dollar exchange rate would have an impact on base business costs in both countries. We also need to take into account the fact that some materials may become scarce in times of heightened demand. On a purely supply/demand basis this can often lead to an increase in the cost of materials.
Components of Aggregate Demand
In this section we’ll examine aggregate demand in purely technical terms.
Aggregate Demand Curve
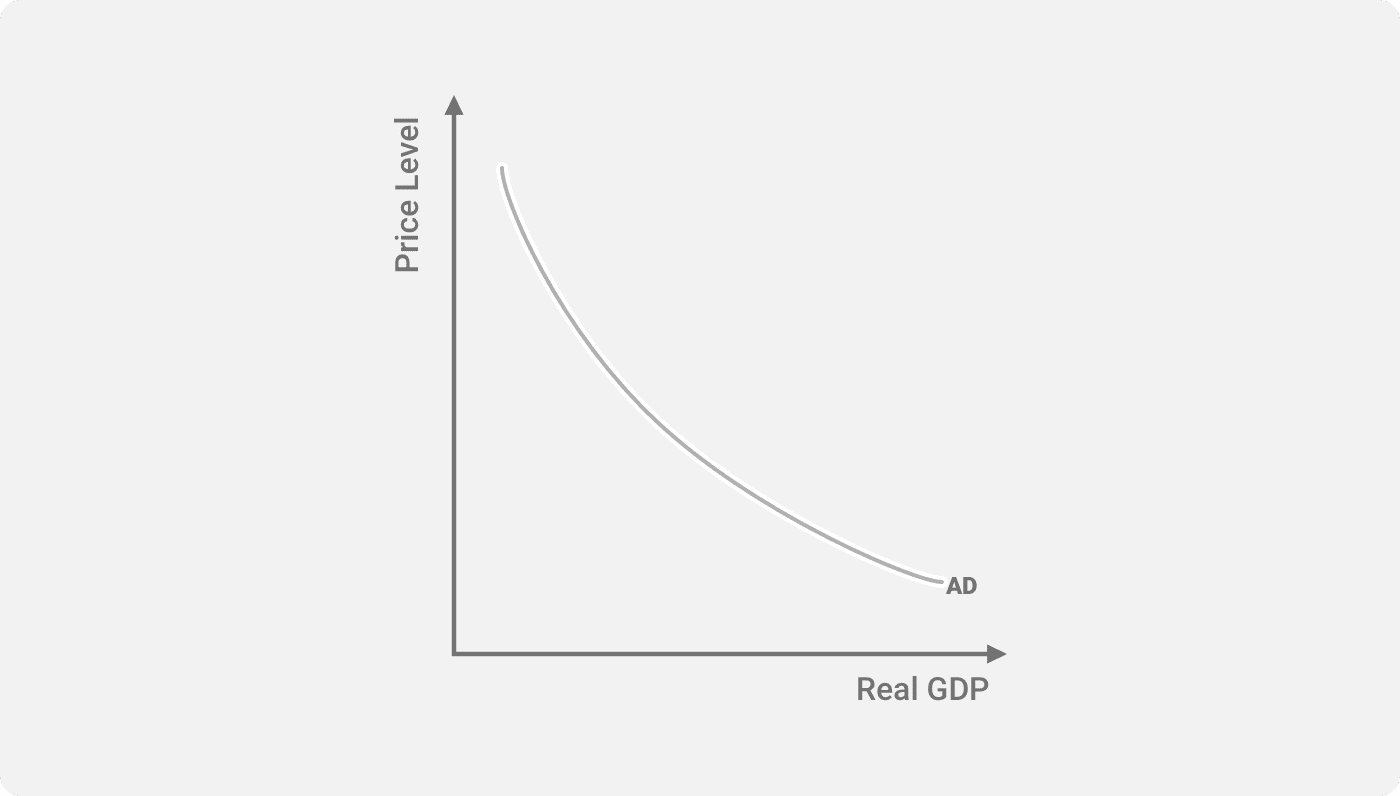
As mentioned before, the aggregate demand curve represents total demand for all goods/services in an economy, in local currency. Take a look at Figure 1 for reference. You’ll see that the curve is skewed towards an increase in aggregate demand as price levels fall. However, it’s not a straight line. The impact certain factors, such as interest rates changes, can and do distort the curve. The first graph also doesn’t show any up- or downwards shifts in the curve. Next let’s take a look at what causes the curve to shift.
Shifts In The Curve
Figure 2 below shows an example of an upshift in economic activity. The result is stronger consumer demand. You can see the curve from Figure 1 shift upwards to the second aggregate demand curve (AD2). For an example of a shift down, the first curve would move down to the third curve instead (AD3). The basic shape of the curve remains the same, but the economic changes cause it to move parallel based on the current economic trend.
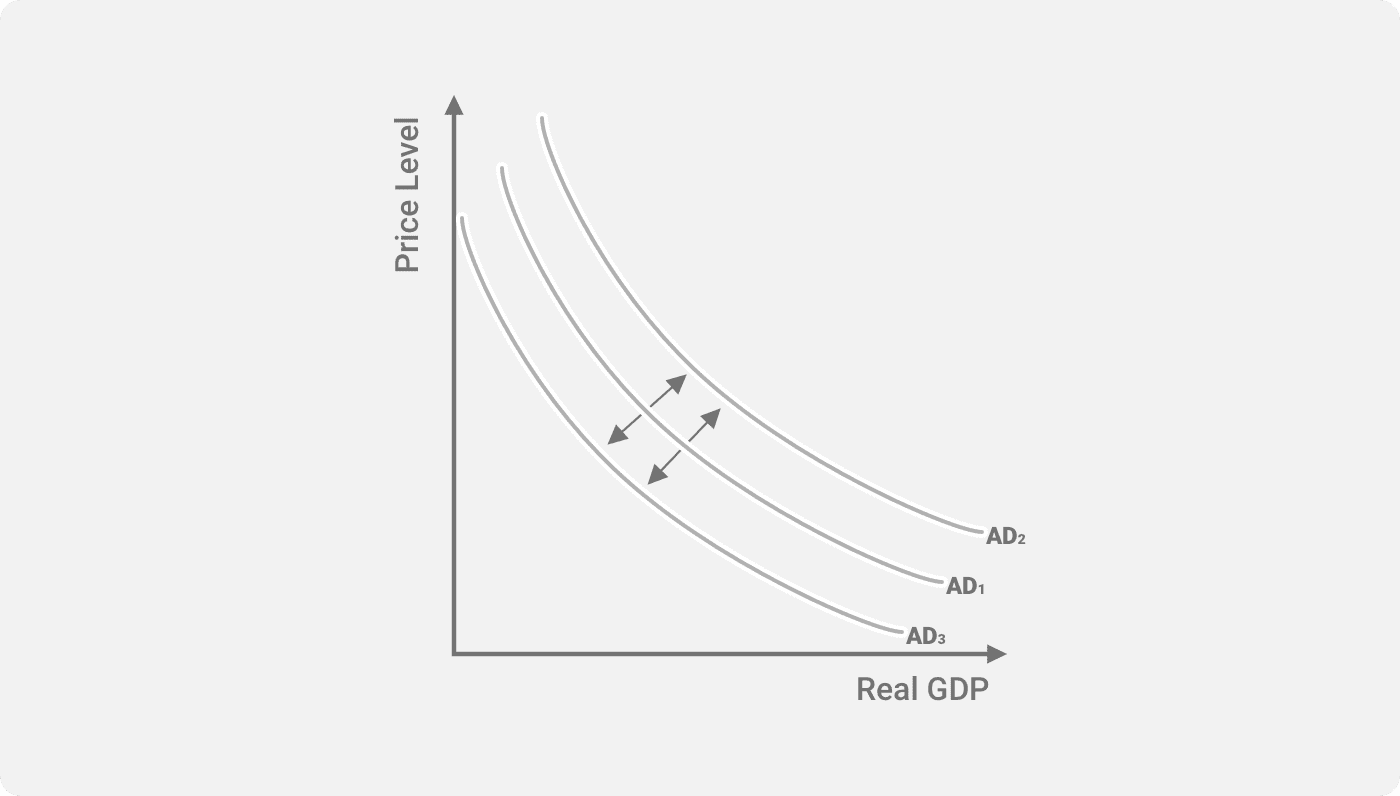
The main point to consider with the two graphs shown above is the increase/reduction in the real GDP rate as a consequence of shifting the curve left and right from the original. This information is extremely useful to investors. They can use it to superimpose their own ideas and assumptions for the future. Those assumptions translate into the shifts in the aggregate demand curve. When you consider that the foundations of a prosperous company/industry are based on the underlying strength of the economy, this should be central to any investment strategy. Next let’s look at the underlying formula used to calculate aggregate demand. This is what governments and economists use to release their own forecasts and trend predictions.
Aggregate Demand Formula
Before we take a look at the aggregate demand formula, it is worth mentioning that both classic Keynesian Theory and Say’s Law make slightly different assumptions regarding economic capacity and GDP. The Keynesian Theory is based on the assumption that aggregate expenditure directly reflects real GDP. As a consequence, if aggregate expenditure is below the real level of GDP this will eventually prompt a reduction in supply/output until equilibrium is regained. In basic terms, the Keynesian Theory suggests that economies are self-regulating.
Say’s Law makes the basic assumption that any level of GDP created by an economy will generate sufficient income to purchase that level of real GDP. Some experts believe there is a flaw in this particular assumption as some income may be retained for savings and not reinvested into the economy. These varying assumptions have certainly given investors and economists’ food for thought. There is also the question of whether increased demand or increased supply drives the aggregate demand curve. This is another complication to the different theories. However, the formula for calculating aggregate demand remains the same.
The formula for aggregate demand is fairly simple:
AD = C + I + G + Nx
Its made up of the following components:
- AD = Aggregate demand
- C = Consumer spending on goods/services
- I = Business investment/spending on non-final capital goods
- G = Government investment/expenditure on public goods/social services
- Nx = Net exports
The above formula is based on an economic model presented independently by Robert Mundell and Marcus Fleming. Now it’s commonly referred to as the Mundell-Fleming Model. There is a more complex formula which includes the individual calculations for C, I, G and Nx. The above formula is the one most often quoted, however.
Frequently Asked Questions
There are numerous ways in which government policies can shift the aggregate demand curve to the right. These include maintaining relatively low interest rates, reducing the tax burden, working towards full employment and encouraging exports. Full employment equates to more disposable income while low interest rates/tax burdens ensure that consumers retain a larger share of their income and business costs remain relatively low. Historically, interest rates have been used as the tool of choice by many central banks/governments, although disinvestment/investment in the economy can also have a similar impact.
Many people might automatically assume that the aggregate demand curve should be a straight line but this would assume that all determinants remain constant. This is not always the case. Even if the determinants were to move in the same direction, they wouldn’t necessarily move at the same rate. There’s also the added impact of imports/exports and the lag between an increase in demand and an increase in production costs. So, when you take a look at it from a distance, the aggregate demand downward slope reflects the actual situation as opposed to the theoretical situation.
The basic idea is that any factor which would increase consumer spending would also lead to an increase in aggregate demand. Some of the more influential factors include relatively low base interest rates, reducing borrowing costs for business/consumers, a reduction in direct taxes such as rates, VAT and income tax. The impact of these factors, best described as expansionary monetary/fiscal policies, would depend upon the impact of other factors which could reduce disposable income or induce a degree of concern amongst consumers. It is also worth remembering that changing the direction of aggregate demand is not something that happens overnight. Although, we have seen some brief, but sharp shifts in the past such as the subprime mortgage crisis of 2009 and the 2020 coronavirus pandemic.
There is an interesting debate as to what actually increases aggregate demand, which brings us to the chicken and the egg argument. Some economists believe that it is an increase in demand which ultimately drives an increase in supply and aggregate demand. Others suggest that the supply needs to be there to induce increased demand from consumers, therefore increasing aggregate demand. In reality it is probably somewhere in between because there needs to be a degree of demand to give businesses the confidence to invest in their operations. As they tend to wait for trends to emerge as opposed to making spur of the moment investments, there can be a lag.
We have seen a long term debate as to how lower taxes impact aggregate demand and ultimately economic activity/GDP. A reduction in taxes gives consumers more money in their pocket and more disposable income. However, on the other hand it also reduces government income and therefore the funds available for investment in public services and infrastructure. However, if the economy is growing then even if tax rates have been reduced there is the potential to make up the difference and even create a surplus. The idea is that the majority of tax savings will be “reinvested” back into the economy thereby improving demand, supply and supporting employment. This perfectly reflects the complicated nature of aggregate demand and illustrates why the aggregate demand curve is shaped the way it is.