
The Aroon Indicator is an effective tool used in the technical analysis of an asset’s price. The indicator signals when there is a strong uptrend or downtrend. It can also help in detecting any changes in trends. It is particularly effective when used alongside other indicators and can help traders identify trends and develop strategies based on them.
This article will show you how the Aroon Indicator is calculated and help you understand how traders can interpret its results to execute trades based on the indications given by these lines.

What Is the Aroon Indicator?
The Aroon indicator consists of two lines: Aroon Up and Aroon Down. The indicator generally has a 14-period (typically days) timeframe for determining the up or down line. Although 14 is the default, setting the indicator for longer time periods is also possible. Setting the indicator to 25 periods is not at all uncommon.
The Up line determines the number of periods we’re away from a high in the corresponding 14-period time frame. Likewise, the down line measures the number of periods we are away from a low.
It was developed by Tushar Chande in 1995, and it means dawn in Sanskrit. It essentially looks to detect the beginning of a trend or a change in trend, and its name reflects that.

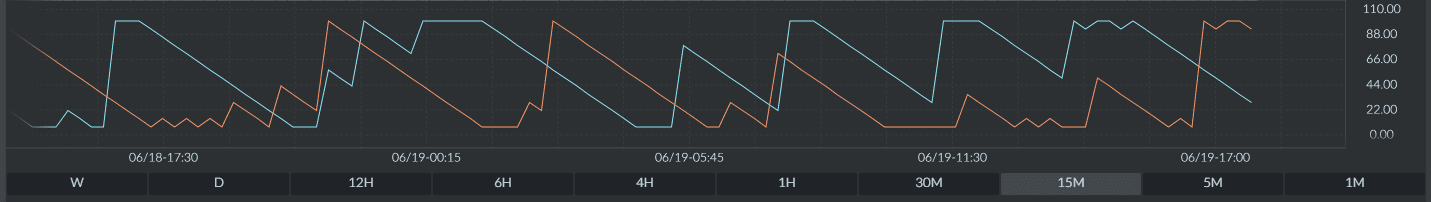
The chart above represents a 14-period Aroon on a daily chart. The blue line is Aroon Up, and the orange one is Aroon Down. The Aroon can also be viably used even on charts with one-minute candles. Smaller time periods are generally preferred for traders who trade more frequently and hold their positions for a shorter time.
You might also enjoy:
- What is MACD? – Understanding How To Use, Read, And Calculate It
- What is Day Trading and How Does It Work?
Aroon Indicator Formula
The Aroon Up or Down determines how long it has been since the last high or low for the current period. The Up or Down values are expressed in percentages and range from 0%-100%. The closer the line is to 100%, the stronger the trend. For example, an Aroon Up close to 90% would indicate a strong uptrend. However, this also has to be accompanied by a low Aroon Down Line to give us confidence in the trend. On the other hand, having the Aroon Down close to 100% simultaneously would also mean a low not long ago.
You’ll find the formula for calculating both lines below. For the sake of simplicity, let’s assume a 20-day period.
Aroon Up = (20 – No. of days since 20-day High) * 100 / 20
Aroon Down = (20 – No. of days since 20-day Low) * 100 / 20
Suppose you want to calculate the Aroon Up value today. We need to determine the point in time when the price was highest in the last 20 days. If that was 2 days ago, then we can use the following equation to find the Aroon Up:
Aroon Up = (20 – 2) * 100/20 = 90
Likewise, if the high were 15 days earlier, the value would be 25. The closer the 20-day high is to now, the greater the Aroon Up value is. This can be interpreted as an uptrend if there is also a low Aroon Down value (typically less than 50%) to confirm it.
How to Use the Aroon Indicator?
Now that we know how to calculate the Aroon Indicator, it would be good to illustrate its use in a practical scenario. Take a look at the highlighted part of the chart below to see an example of a signal provided by the crossover between the up and down lines.
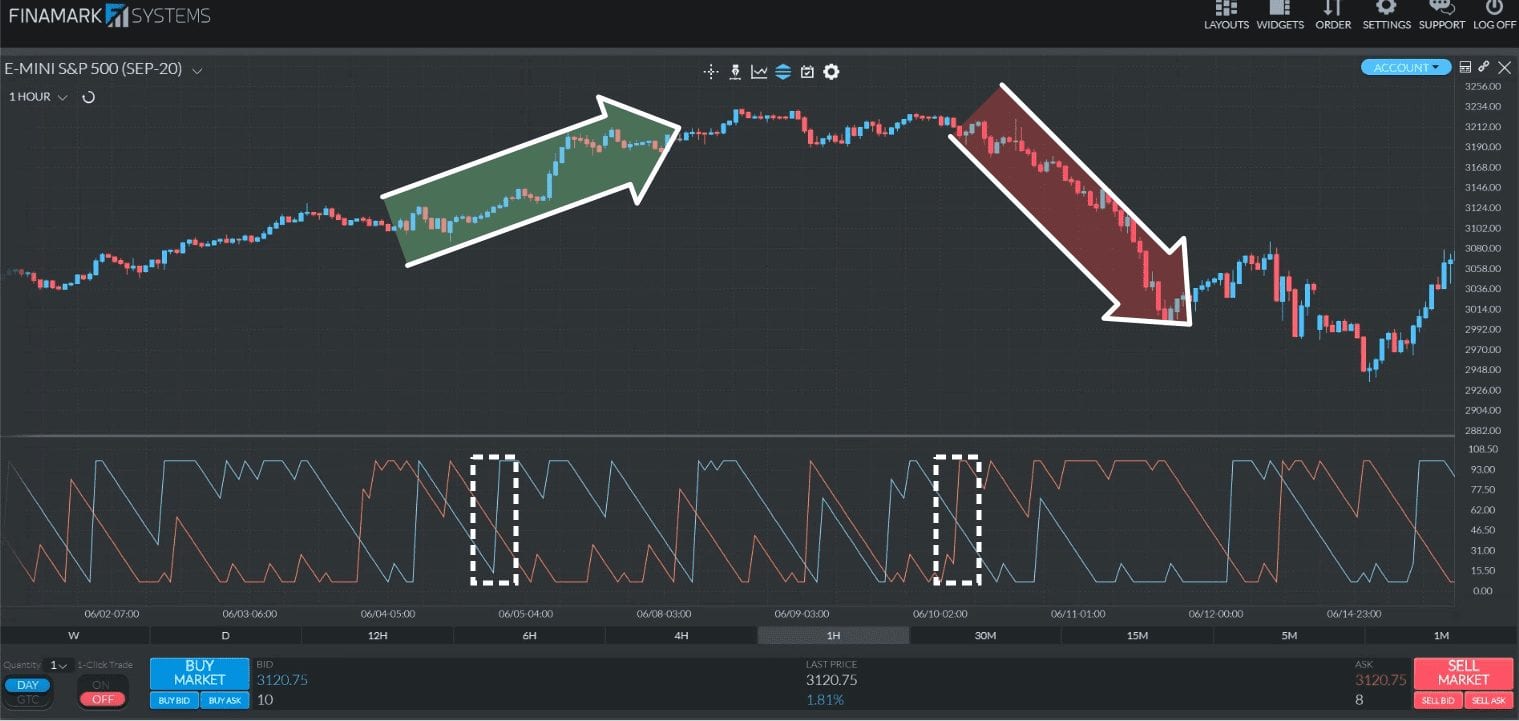
Whenever there is a crossover, it indicates that a trader can expect a reversal in the trend. In this case, the down line crossed over the up line and hit the 100% mark. Before this, there was an uptrend in the price, and the crossover indicated that the prices would drop. The indication turned out to be true as we see the price falling continuously for a few days.
The chart also shows numerous cases where the lines move in tandem. One such instance is highlighted below.
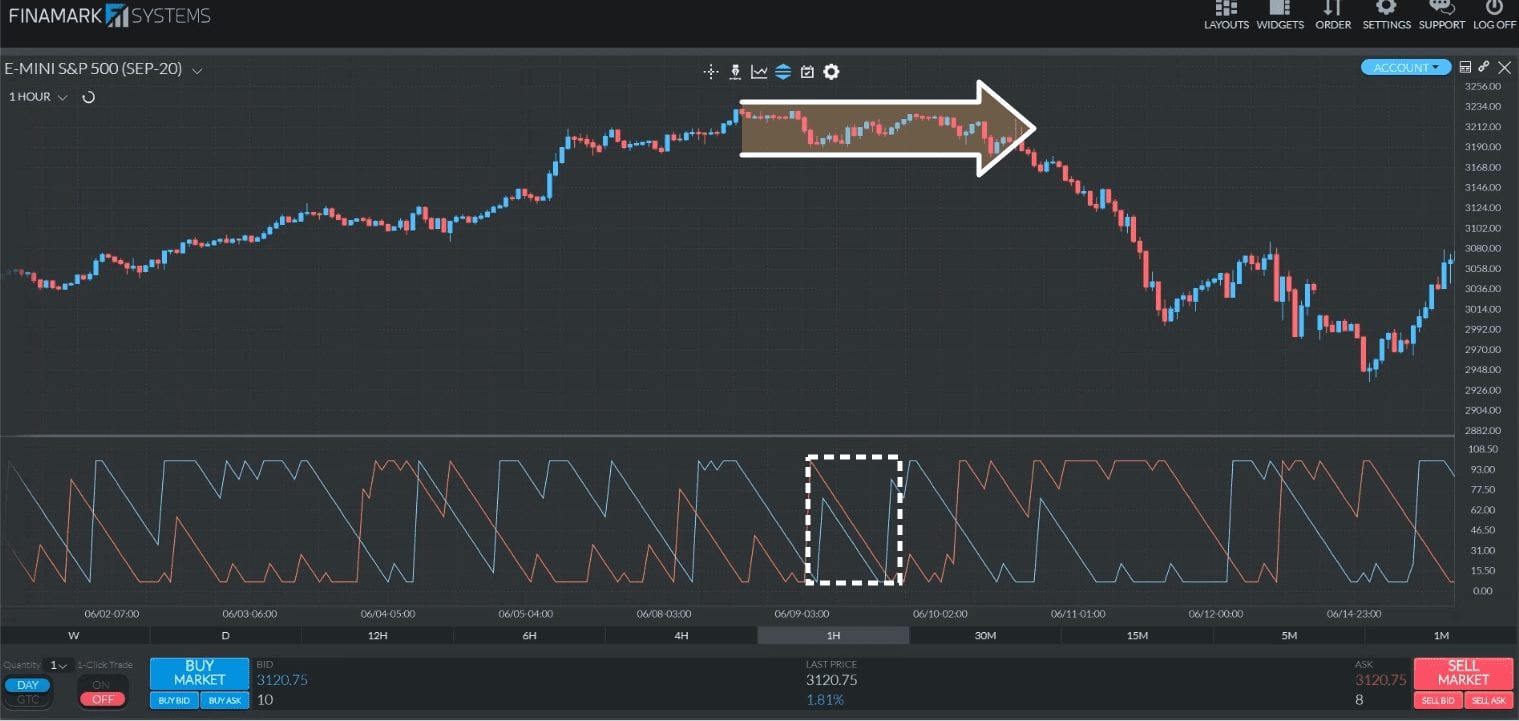
In this case, both the Up and Down line trend downwards indicates no specific price trend. Looking at the trend, we can see a period of consolidation where the price is almost flat. In a phase of consolidation, there’s a chance that any small move may significantly impact the Aroon Lines because the highs and lows are close to each other.
Aroon Lines could, therefore, be used by traders to forecast any buying or selling opportunities depending on the strength of each line. If an Aroon Up is above 50% and Aroon Down is below 50%, it could indicate an uptrend. When both the lines are close to each other, there is no definite trend.
Setting Up the Aroon Indicator
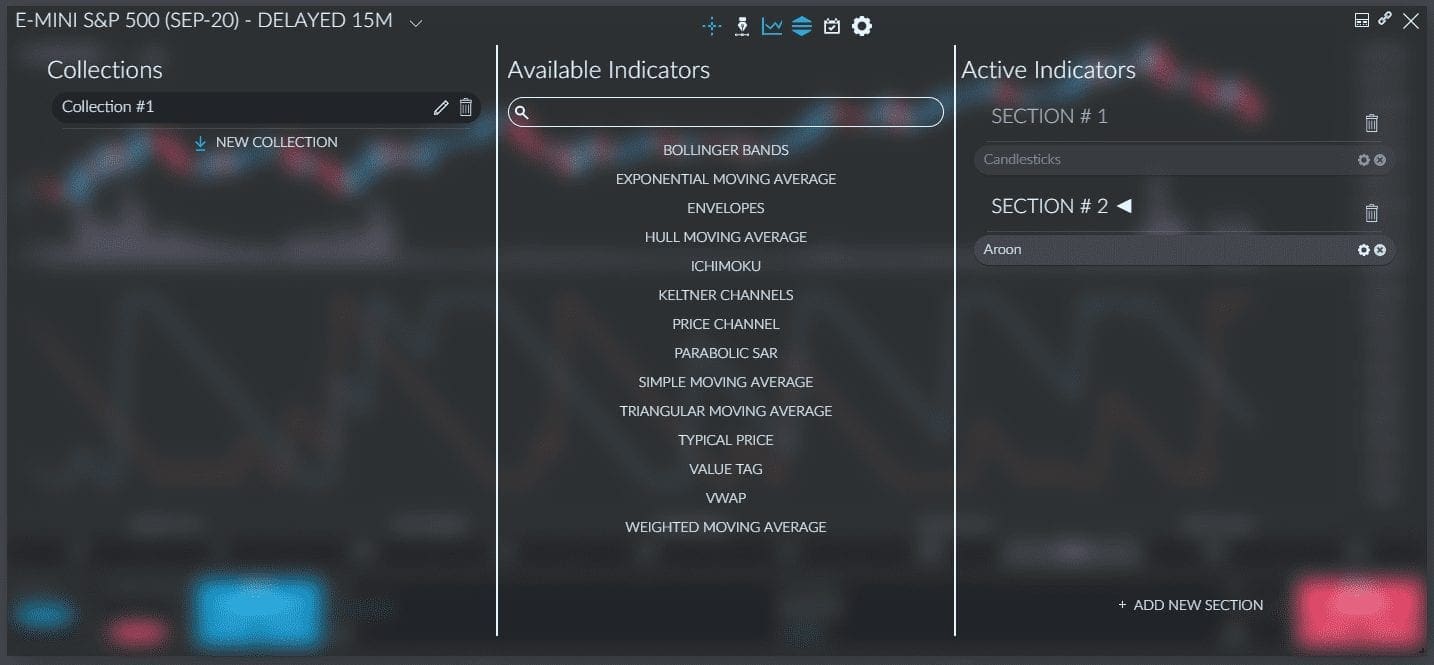
Many platforms like Finamark have a dedicated section for technical indicators, as highlighted below.
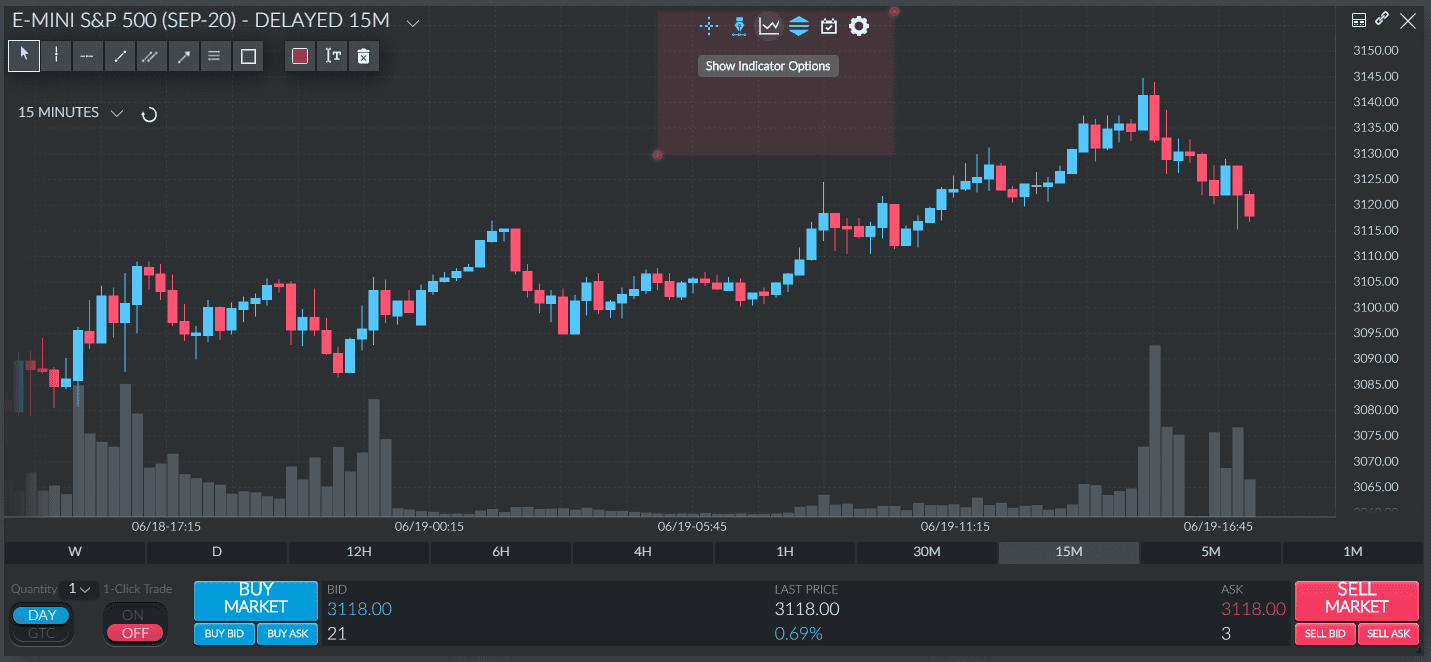
On opening that menu, there is a range of options to choose from. Search for Aroon and add it to the list of Active Indicators. This indicator may not be available on all online platforms.
Most platforms give traders the option to choose the time interval for calculating the Aroon Lines. There are options to trace the Aroon Lines based on a 1-second period for someone looking to benefit from short-term trades. Those aspiring to trade less frequently can opt for a longer duration, like 1 week.
The smaller time interval offered by Finamark Systems gives an advantage to traders who are keen on trading very frequently. It enables them to trace the signal beforehand, which would not have been possible had the interval been longer.
Advantages and Disadvantages
Advantages:
- Easy to comprehend – Interpreting the lines can be relatively simple and does not involve complex mathematical expressions.
- Effectively signals changes in trends – Line crossovers can signal an increase or loss in momentum to the traders.
- Flexibility in choosing the interval – Traders can change the length of the time period for calculating the Aroon Lines based on how frequently they trade.
Disadvantages:
- Lagging indicator – The Aroon Lines are based on historical prices, so they will form with a delay compared to the underlying trend.
- Influenced more by time than price movements – Since it depends only on how long ago the last high/low was witnessed, the indicator does not provide any information on the magnitude of change that could take place.
- Should be used in conjunction with other indicators – On a standalone basis, the signals provided may not always be accurate, and it is always better to use them in tandem with other indicators.
Differences Between Aroon Indicator vs. Aroon Oscillator
Aroon Oscillator can be considered an extension of the Aroon Indicator and measure how strong or weak the trend is. The Aroon Oscillator, in other words, confirms whether the trends that can be seen building up in the Aroon Lines should be used to interpret if there is a valid trend. The Oscillator is the difference between Aroon Up and Aroon Down, and the range is from 0%-100%. When it is close to 100%, a trader can be confident in the signals coming from the Aroon Lines.
Earlier, we mentioned that a high Aroon Up and a low Aroon Down would imply that an uptrend is around the corner. The Oscillator, in this case, would also generate a high value, which would confirm our estimates. In short, the Oscillator is just a way of telling us how confident we should be of the Aroon Indicator.
Which Indicator Works Best With Aroon?
The Aroon Indicator does not give any hints on the magnitude of the move that could take place. So, there could be other indicators you could use in addition to it. The Aroon Oscillator, for example, could be useful for a preliminary analysis. Price action should also be used in conjunction with the Aroon since the lines may not necessarily react quickly enough to predict a downtrend. Often, the crossover between the Up and Down lines only happens while we’re already in the middle of a significant upwards or downwards move. Many different chart patterns prove useful in predicting the future price of a share. Patterns like triangles and the like could be used along with Aroon Lines to confirm your technical analysis conclusions. These patterns generally are more predictive in nature and could give traders an advantage by keeping them ahead of the curve.
F.A.Q
The Aroon Indicator is a useful tool that can be used by traders to track stock price trends. While the lines may not catch a trend immediately, the results generally tend to be accurate and reliable. When used with other indicators like the Aroon Oscillator to confirm the movements, the reliability of the Aroon Lines improves significantly.
The Aroon Indicator measures how recently there was a high or a low depending on our chosen timeframe. The Aroon lines can be used to determine if there’s an active trend or whether we see a reversal in the trend. The lines also signal whether there is any price consolidation taking place.