Most technical indicators are based either on an instrument’s actual price and its behavior or trading volume. The Average True Range or ATR is a volatility-based indicator that compares the current price to the entire range for a particular period. The indicator is very simple to understand yet very powerful and also serves as a basis for other technical indicators like the Supertrend Indicator.

What is the Average True Range?
To understand what ATR is, one must first get familiar with the difference between range and True Range. The range calculation takes into account only the prices during a particular period. In simple terms, the range is the difference between the high and the low for a given period.
The calculation for the Range can suppress the volatility measure if the intra-period volatility is low, but there is a substantial price movement within different periods. Here is an example – suppose yesterday’s closing price was $50. When the market opened, the price jumped to $60. If the intraday price remains above $60, the calculation of the range won’t take into account the jump from $50 to $60.
For such deviations, the True Range comes in handy. Think of it as a more refined version of the range. While the range requires the high and the low for the day, the True Range also takes into account the previous closing price as an input.
True Range Formula
The formula for the True Range is:
True Range = max (High – Low), abs (High – Close₁), abs (Close₁ – Low)
where:
High and Low refer to the current bar
Close₁ is the close of a previous bar
Suppose the previous close is $50, and the high and low prices are $60 and $55, respectively. In that case, the calculation is as follows:
True Range = max (60 – 55, 60 – 50, 55 – 50) or $20
On the other hand, the range is only $5 ($60 – $55), and this figure clearly underestimates the volatility. Therefore, the range is not appropriate when the intraday prices are above or below the previous closing price. In the example, a True Range is a more appropriate measure of volatility since it doesn’t suppress the impact of the last closing price on the calculation of the range even when the price has continued to trend upward during the day.
ATR is simply the average value of all the true ranges for a given period. For n periods, the ATR is calculated as:
ATR = 1/n * sum (TR1 + TR2 + ……….+TRn)
Where TR is the True Range for each period.
How to Calculate the ATR
The formula above gives the exact value of ATR. It requires the exact True Range figures for each preceding period. There is also an approximation method that takes into account the ATR of the previous period alongside the current True Range. Based on the approximation formula, ATR is calculated as:
ATRn = [ATRn-1*(n-1) + TRn]/n
The above formula replaces one ATR value with the current True Range and recalculates the ATR for the latest period.
Assume the ATR for a 10-day period is 1.50 and the latest TR is 1.55. The latest ATR would be:
ATR = [1.50*(10-1) + 1.55]/10 or 1.505
The approximation method may not yield current results if the previous ATR value is driven by the high True Range of the oldest period. Suppose the True Range values for the last 10 days were 6, 1, 1, 1, 1, 1, 1, 1, 1, and 1. In this data set, “6” is the True Range of the oldest time period and should be eliminated first when the next ATR is calculated. The ATR for the last day would be, say 1.5, and using approximation, the current ATR would be 1.505.
However, based on actual calculation, ATR = (1 + 1 + 1 + 1 + 1 + 1 + 1 + 1 + 1 + 1.55)/10 or 1.055. This is significantly different from 1.505, which was calculated by approximating. This shows the impact of the oldest data in the approximation formula. Since the oldest True Range was very high, it led to a sharp reduction in the latest ATR value once it was eliminated. The approximation method assumed that all 10 days had a True Range of 1.5, and so the impact of removing the oldest data set on the ATR was minimal.
How Does the ATR Indicator Work?
ATR is a measure of volatility, and assets with higher volatility have higher ATRs. Traders can use ATR to place trades based on how the asset behaves.
Reading the Average True Range Indicator
The Average True Range value increases when the price is highly volatile. During periods of consolidation, the Average True Range has lower values. Since it is a volatility measure, the ATR doesn’t indicate buying or selling pressure. It simply signals when volatility is very high and when you can expect a sharp change in price.
The following chart is an example of how to visualize the Average True Range along with the change in price. Since the ATR measures volatility, it doesn’t use the same scale as price.
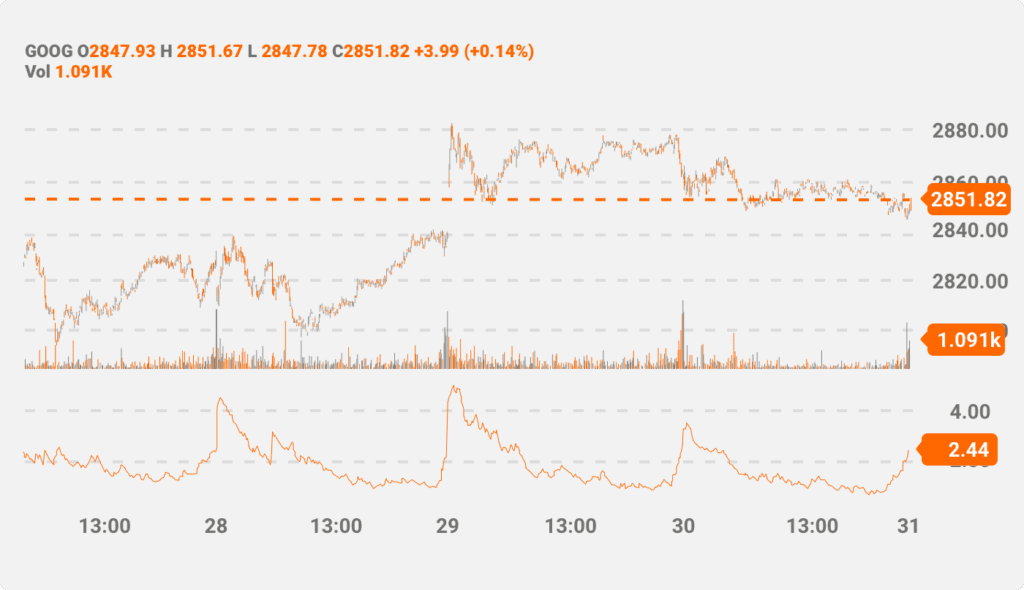
The red line in the bottom section represents the ATR line. You can clearly see three peaks. These are periods of extremely high volatility. The peaks are also evident when there is a sharp rise or a sharp drop in the price. Before making any decision based on the Average True Range, a trader should also watch out for the price action and understand the trend.
The ATR peaks form before extreme price movements. That’s why traders commonly use the technical indicator to figure out entry and exit points. Some traders also use a multiplier to detect abnormal price movements (an ATR with a 1.2 multiplier, for example).
How to Use Average True Range for Day Trading?
Average True Range is a very simple tool. You can calculate it based on a few minutes for day trading activities involving assets like foreign exchange, equity, or commodities. The default setting has a length of 14, which the trader can change according to his preference. Longer lengths are less reactive to price changes, whereas shorter lengths are more sensitive.
One of the most straightforward applications of the Average True Range is to identify periods of high volatility. In the chart above, you can see three instances of a volatility spike. The higher the spike, the more substantial the volatility. Cases like these indicate that the price has moved by an amount higher or lower than the historical average.
Some traders tend to apply a multiplier above the ATR value. In such cases, the trades are only executed when the ATR value reaches a particular value.
It is also important to note that the direction of movement can’t be identified simply by looking at the ATR chart. It is important to complement it with other technical indicators as well.
Examples of ATR Trading
The following intraday chart shows the price of Tesla along with the technical indicators Average True Range and Relative Strength Index (RSI). The RSI (highlighted in purple) is a momentum indicator that shows if the price is in overbought or oversold territory. An RSI value over 70 is a signal for selling the stock since it is in the overbought zone. Likewise, an RSI below 30 gives an indication to buy.
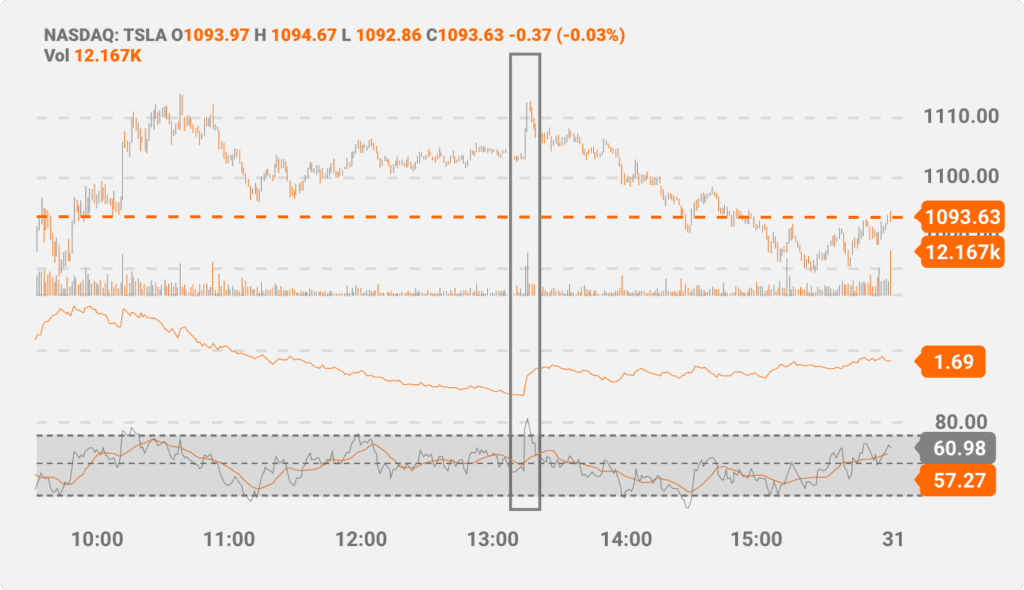
In the area highlighted in blue, there is a spike in the ATR value. Similarly, the RSI value is also above 70. The two indicators give a sell signal.
The ATR in the above chart is based on single-minute price points. However, in the general case, it can be based on much shorter intervals. Since ATR doesn’t hint at the direction of future price movements, the addition of RSI makes it easier for the trader to decide what position to take. Other technical indicators can also work here to help provide directional calls and improve the trading strategy. Such include trading volume-measuring indicators, moving averages, Bollinger Bands, and more. The ATR is a flexible tool. We can use it across different asset classes, including the derivatives market.
Using the ATR for Futures vs. Stocks
The example above reveals an intraday trading scenario for stocks. However, a trader with a longer time horizon can configure the price chart to a few days. In intraday stocks trading, the leverage is lower than when trading futures contracts or other derivatives. At the same time, this limits the potential loss a trader can make if his price prediction is wrong.
Therefore, the use of ATR in futures trading can help generate higher returns at the expense of more risk. ATR lines can be handy in volatile futures markets like commodities and foreign exchange. Traders can also use multipliers over the ATR line to create stop-loss triggers.
Like other assets, when applying ATR for futures trading, the trader needs to be wary of the direction the signal is hinting at. Using other technical indicators to complement it is highly advisable, especially when trading derivatives. Since small tick movements can lead to higher gains or losses, it is also essential for futures traders to calculate the ATR for smaller time intervals (minutes instead of hours).
Average True Range Drawbacks
The Average True Range is a robust approach for measuring volatility. Most charting tools allow the addition of the Average True Range. While it is easy to comprehend, the ATR indicator has its disadvantages. Some of them include:
- ATR isn’t indicative of price jumps or drops: The ATR can peak irrespective of whether the price is expected to rise or fall. This makes it confusing for traders who only observe the ATR for trading signals. It is imperative to use other technical indicators to get a more accurate picture.
- ATR isn’t useful during a consolidation phase: There is little activity in the ATR line when the price is trending sideways.
- The ATR can provide an incorrect signal when the trend is extremely strong: When there is a sharp rise or drop in price, the ATR can give a trading signal contrary to market expectations. While the asset may be in overbought territory based on volatility measures, there could be reasons why the uptrend could continue further.
Final Thoughts
There are several volatility-based technical indicators. However, most of them are complicated to interpret. The ATR is a much easier approach to understanding volatility, and the results are pretty straightforward. A trader only needs to configure the period. It is also helpful in validating the outcome of other charting tools and can be used in intraday trading.