
Unfortunately for many traders, price movements aren’t just a game of ups and downs. Often, the most accurate trading signals are in the strength of the trend. That is to say, how likely is it for the price to firmly continue its trajectory or get weaker and reverse course. Traders use many tools to evaluate the trend’s strength. The Average Directional Index is among the most popular and efficient indicators for this purpose. This guide explores the concept and history of ADX. We’ll look at its advantages and disadvantages and how you can use it to enhance your trading strategy.

What is the Average Directional Index?
The Average Directional Index (ADX) is a technical indicator that measures the strength of the trend. The indicator is non-directional and is derived from two-directional movement indicators (DMIs).
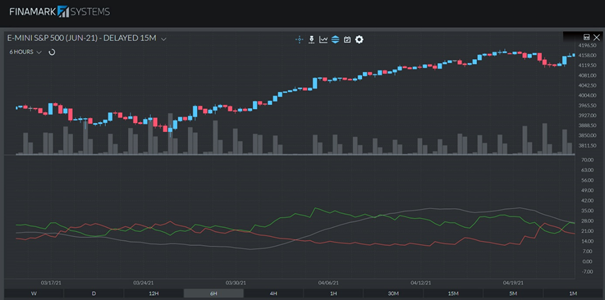
The indicator is plotted as a line with values between 0 and 100. On a chart, the ADX line is accompanied by two separate directional indicators – the positive directional indicator (+DI) and the negative directional indicator (–DI). All of them are momentum indicators.
The ADX line is usually plotted in white, while the +DI and DI lines are green and red. Altogether, they highlight the direction of the trend and help determine its strength.
Traders use the lines and the relation between them to decide whether they should go long, short or avoid trading altogether.
Aside from identifying stronger or weaker trends, traders use the ADX to plan their entry and exit points.
The main goal of the indicator is to help you find out exactly how strong the current trend is. Quantifying its strength and visualizing its direction comes in handy for day traders, short-term investors, scalpers, and basically all types of market participants.
The indicator’s application isn’t hard to master, although it might intimidate beginners at first. The reason is that it consists of three separate lines, and analyzing all of them simultaneously might be a bit confusing. However, with enough practice, the ADX can become quite fun to use!

A Brief History of the ADX
The Average Directional Index was developed by one of the most famous technicians of the 20th century – J. Welles Wilder. In 1978, he introduced the technical trading tool for the first time in his book “New Concepts in Technical Trading Systems.” Although this was more than 40 years ago, the indicator is equally efficient today.
At first, the indicator was intended to serve the needs of commodity day traders. However, today, it is applied across almost all markets, including stocks, ETFs, mutual funds, and futures.
In fact, Wilder’s work is so essential that today many of his concepts are at the core of all charting software. He is also the father of some of the most popular indicators, including the Relative Strength Index (RSI), the Parabolic SAR, the Average True Range (ATR), and more.
How to Calculate the ADX
Calculating the ADX is based on a moving average (MA) of the price range expansion for a certain period of time. Alternatively, it is the average of the directional index (DX) values over the specified period.
On most platforms, the default setting for the indicator is 14 bars (or periods.) However, other time frames can also be used, depending on the trader’s preference.
Now, let’s see how the calculation process goes. Note that, although it might seem a bit confusing, the good thing is you won’t have to go through it every time you apply the indicator. The steps below are just for your reference and to help you understand the indicator’s mechanics. When trading, you will simply be leaving the computer to do the job.
Calculate the ADX in 12 Steps
- Start by calculating the true range (TR) and the positive and negative directional movements (+DM and –DM) over 14 periods.
- +DM = current high – previous high.
- –DM = previous low – current low.
- The results determine which one to use to proceed with the calculation. Go with the one with the higher value.
- The true range (TR) is equal to whatever is greater of the current high – current low, current high – previous close, or current low – previous close.
- Now it’s time to smooth the 14-period averages of the TR, the +DM, and –DM. Here, you should include the -DM and +DM values to calculate their smoothed averages. The formula for the TR is: First 14TR = sum of first 14 TR readings, while the Next 14TR = first 14TR – (prior 14TR/14) + current TR.
- The smoothed +DM value is divided by the smoothed TR value. Multiply it by 100, and you now have the value for the +DI.
- To find the value of –DI, divide the smoothed –DM by the smoothed TR and multiply by 100.
- The directional movement index (DMI) equals +DI minus –DI, divided by the sum of the +DI and the –DI, multiplied by 100.
- To calculate the average directional index (ADX), you should find the values of the DX for all 14 periods.
- The first ADX equals the sum of the 14 periods of DX, divided by 14.
- For the rest, use the following formula: ADX = ((prior ADX * 13) + current DX) / 14.
Average Directional Index Formula
The list of calculations above might have scared you a bit, but don’t worry – when you trade, all of this will be automated. Yet, it is always good to be familiar with the formula that generates the tool you rely on to earn profits.
So, here is the Average Directional Index formula at a glance:
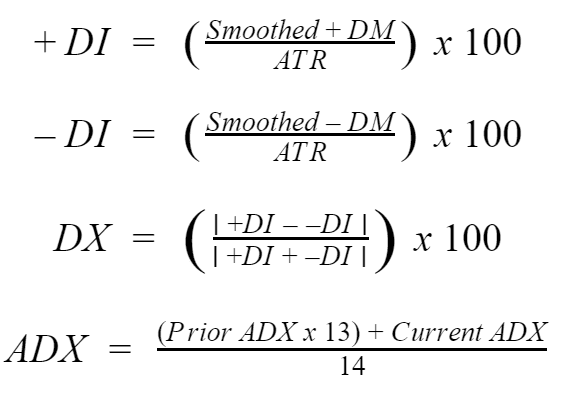
Where:
+DM (Directional Movement) = Current High – Previous High
-DM (Directional Movement) = Previous Low – Current Low
ATR = Average True Range
How to Interpret the ADX Indicator
The most accurate way to interpret the ADX indicator is by remembering that its line shows the overall trend strength by rising during stronger price movements and falling during weaker ones. The strength of the trend is visualized by the rise of the positive directional indicator (+DI). In contrast, the strength of the market drop is reflected by the downward movement of the negative directional indicator (-DI).
That’s not all – you should keep an eye on where both lines are compared to each other. If the +DI floats above the –DI, the market is usually in an uptrend. And vice-versa.
To make it clearer, let’s add some numbers and context.
A trend is considered strong when the ADX ranges above 25 and weak if it is below it. By looking at the values of the ADX, you can get a sense of whether the market is trending or non-trending. However, it is also important to look at the time period for which the ADX ranges above or below the 25-mark. Usually, the bigger the period, the more accurate the signal of a ranging market.
How most traders interpret it
| ADX Value | Trend Strength |
| 0 – 25 | Weak trend |
| 25 – 50 | Strong trend |
| 50 – 75 | Very strong trend |
| 75 – 100 | Extremely strong trend |
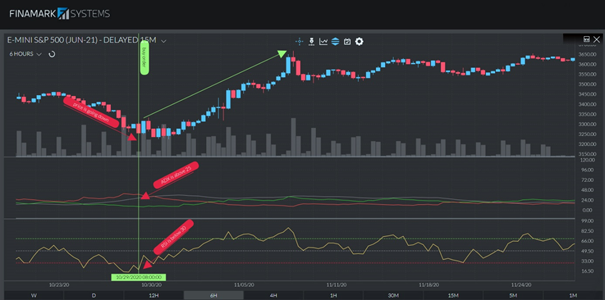
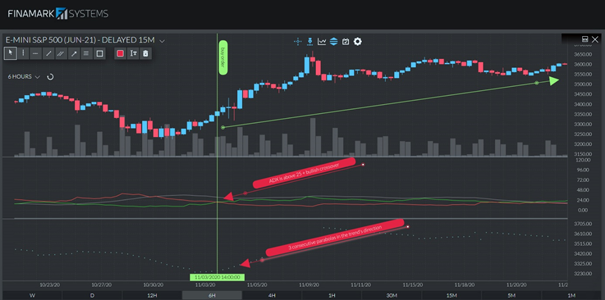
A crossover between the +DI and the –DI is also a useful signal. When the +DI line crosses above the –DI one and the ADX ranges above 25, this is considered a buy signal. On the other hand, when the –DI crosses above the +DI and the ADX ranges above 25, traders usually go short.
Also, make sure to look at whether the ADX line marks consecutive higher highs or lower highs. In the first case, it means the trend momentum is increasing. A series of lower peaks, on the other hand, indicate a decreasing trend.
However, bear in mind that the ADX can also generate non-trending signals. What these mean basically is that the price is too volatile to form a clear direction.
Average Directional Index Strategies
In general, any time the trend changes its character, you should make sure to reevaluate your positions and rethink your risk strategy. So, how do you do that?
The best way is by looking for the most common signals. These include:
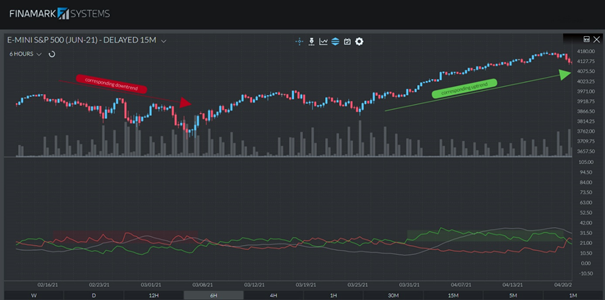
Divergence
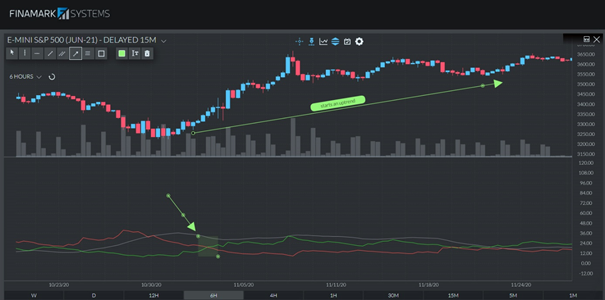
The general idea here is that as the trend develops, the value of the ADX should be rising accordingly. However, if the opposite takes place, you have a divergence.
When the instrument’s price makes a higher high, while the ADX makes a lower high, you have a divergence. This isn’t necessarily a reversal signal but mostly a warning that the trend is changing.

A divergence might mean several things, including trend consolidation, correction, reversal, or even continuation. Not very helpful, huh?
The best thing here is to tighten your stop-loss and look for signals from other indicators (more on this below). If you can’t identify the most likely market development, it might even be a good idea to capture your profits and close your positions.
The divergence signals generated by the ADX are very similar to those from oscillators like the MACD or the RSI.
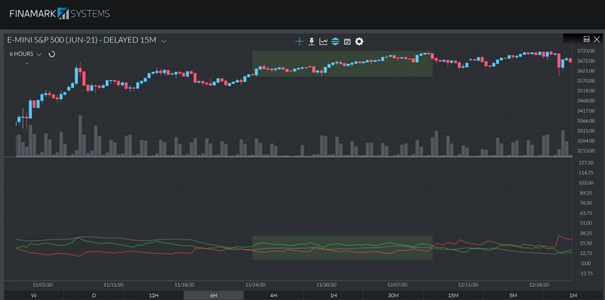
Identifying ranges
One of the trickiest parts of trading is capturing the moment price patterns move from trending to ranging. Using the ADX can help a lot in this regard.
The most common signal that the market is ranging is when the indicator drops below 25 but doesn’t surpass 20. Alternatively, this is when the trend is slowing down, but still not enough to be considered weak.
When ranging, the trend is moving sideways, and the market is kind of calm, without the significant prevalence of either buyers or sellers. Should the supply/demand ratio change, however, the market will react by breaking the range.
The best thing to do during ranging markets is to keep calm and avoid trend-following strategies. You can proceed to buy/sell when a reversal occurs. If the reverse happens around the support line, you can go long, while if it takes place around the resistance line, you can go short.
Trend Direction and Crossovers
ADX is the most effective when the market is trending, which, fortunately, is most of the time. When there is a well-established trend, make sure to look for crossovers between the +DI and the –DI lines.
If the +DI crosses from below the –DI and the ADX are above 25, expect a bullish price movement. At that point, you can open a long position. On the other hand, when the –DI crosses from below the +DI and the ADX is above 25, you can consider it a good moment to go short.
ADX crossovers are also helpful for timing your entry and exit points. In a situation where you have a long position and the –DI crosses from below the +DI, it is advisable to lock your profits. You can either close your position entirely or use trailing stops and capture a part of the profits.
However, bear in mind that the ADX indicator often generates whipsaws or unreliable signals. That is why it is essential to complement it with other technical trading tools.
ADX and RSI
Combining those two indicators brings you a system that measures the trend’s strength and signals when the market is overbought or oversold.
Applying this strategy requires you to place a buy order when the price is going down, the ADX is above 25, and the RSI is below 30. On the other hand, if the price is ranging high, the ADX is above 25, and the RSI is above 70, you can consider the market overbought and open a short position.
When you apply this combination, you can place a stop-loss at the last high of the ADX indicator.
ADX and MACD
These indicators complement each other well because they provide a more detailed picture of what is going on with the instrument’s price.
While the MACD helps better determine trend direction, it can also signal a reversal. Pretty similar to what ADX can do, right? When combined, however, you get a more accurate reflection of the market developments.
You can look at the MACD to detect reversals and rely on ADX to qualify them (whether strong or weak).
To get more practical – you can go long when the MACD goes above zero, and the ADX rises above 25, while the +DI crosses from below the –DI. And vice-versa.

ADX and Parabolic SAR
This strategy is useful mainly to cut the false signals potentially generated by the ADX to a minimum. Complementing it with a leading indicator like the parabolic SAR ensures traders’ ability to capture maximum returns while the market is trending.
When trading this combination, look for when the Parabolic SAR prints at least three consecutive parabolas in the trend’s direction. Once this happens, you can open a position. On the other hand, if three successive parabolas go against the trend, you have an early exit signal.
Common Mistakes When Using the ADX
It is fair to say that the ADX isn’t the simplest of indicators, which is why traders often make a few crucial mistakes when applying it.
The first notable mistake is to act rashly and open a position once you see anything resembling a signal coming from the ADX. Bear in mind that it produces many false signals, so if you don’t complement it with an additional indicator for further confirmation, you risk entering a losing position. One example is ADX crossovers, which usually take some time to form. If you rush into a trade the first time they appear, or without confirming them with a signal from another indicator, you might enter or exit the market too early and fail to capitalize on the maximum profits.
Another common mistake is when traders consider a falling ADX line a sign of a trend reversal. This is true only when the ADX is below 25. If the line is just falling but still above the 25-mark, it indicates that the trend is weakening.
Lastly, make sure to avoid trading during ranging markets as the ADX is prone to generating false positives if not accompanied by a leading indicator. The indicator has repeatedly proven that it is the most effective when applied during clearly established trends and not during sideways markets.
Advantages and Disadvantages
The ADX has been proving its efficiency for over four decades already. However, like any other indicator, the ADX isn’t perfect, and it doesn’t fit all market conditions. That is why it is essential to get familiar with its drawdowns and benefits before deciding whether it can help improve the efficiency of your trading strategy.
The pros and cons of the average directional index (ADX) can be summarized as follows:
Pros
- Highly reliable indicator in trending markets
- Helps with finding the strongest trends to trade
- Accurately quantifies the strength of the trend
- Alerts about changes in trend momentum
- Can help confirm the validity of a trend breakout
- Works with a variety of instruments
- Allows you to see the strength of the buyers and the sellers at the same time
Cons
- It is a lagging indicator that follows price
- Less effective during sideways market movements
- Can generate false signals if used on shorter periods
- It can’t be used as a standalone indicator
Final Thoughts
In a nutshell, considering that the best profits usually come from catching strong trends, there isn’t a better tool for the purpose than the ADX.
The average directional index (ADX) is one of the most complete indicators, and learning how to use it will surely benefit your trading strategy. It is an invaluable part of many traders’ arsenal of tools, especially when paired with other Parabolic SAR or RSI indicators.
However, like any other technical indicator, the ADX can’t provide 100% accurate signals all the time. To make the most of it, make sure to apply it cautiously and double-check its signals on multiple time frames.