
Day trading is among the most challenging and demanding activities. However, with a blend of the right skill set and the appropriate tools, day trading can become a satisfying and potentially lucrative full-time occupation. And while the skills come from experience and hours of dedication, the best day trading indicators are well-known. This guide features the best technical indicators for day trading and shows how to use them to take long and short positions.

Best Day Trading Indicators
Before focusing on the best day trading indicators, we should start by nailing down the essence of day trading.
Day trading is a form of active trading where the trader buys and sells securities multiple times within a single trading session. Day traders capitalize on the intraday price swings and never carry open positions overnight. They prefer highly liquid assets so that they don’t risk being locked in a trade. Day traders can be seen trading on all markets, but forex, futures, and stocks are the most popular ones.
Over time, day trading has established itself as the most popular and widely-preferred form of trading activity. You can learn more about it in our dedicated guide.
Now that you know what day trading is, it is time to focus on the best trading indicators for the purpose.
As mentioned already, day traders thrive on volatility. That is why their focus is to capture price action and market momentum quickly. With that said, it probably already rings a bell in your head about day traders’ most preferred indicators.
Day traders employ leading indicators since they are interested in predicting the price’s next direction. They use indicators that allow them to measure volatility and momentum, as well as tools that signal when the trend is about to change direction. They also rely on volume indicators to get a sense of the magnitude of the buying and selling activity taking place on the market.
As evident, day traders capitalize on the entire spectrum of technical trading indicators. The list ranges from momentum and trend to volume and volatility-measuring tools. Even lagging indicators come in handy to confirm signals from the leading ones.
How to Take Long and Short Positions Using Day Trading Indicators
Needless to say, the end goal of every day trader is to close the trading session with a profit. Some traders buy and sell more actively so that they can achieve a series of small gains. Meanwhile, others aim for one or two bigger wins. However, no matter their strategy, both types of day traders rely on similar trading indicators. These include (but aren’t limited to) the Relative Strength Index (RSI), the Moving Average Convergence Divergence (MACD), Bollinger Bands, Stochastic Oscillator, and more. More about them in a minute.
No matter the indicator, the goal of each trader is to identify the single best moment to enter and close a trade to maximize their profits. Alternatively, to buy at the bottom, right before the price starts ascending, and sell at the top, just before the price starts going down.
In the following few paragraphs, we will explore how and when to take long and short positions based on the signals of some of the most popular day trading indicators. Of course, as always, we advise not to trade solely based on the signals of a single indicator. Instead, create a system of indicators that complement each other and can adequately attest to the reliability of the signal.
Relative Strength Index (RSI)
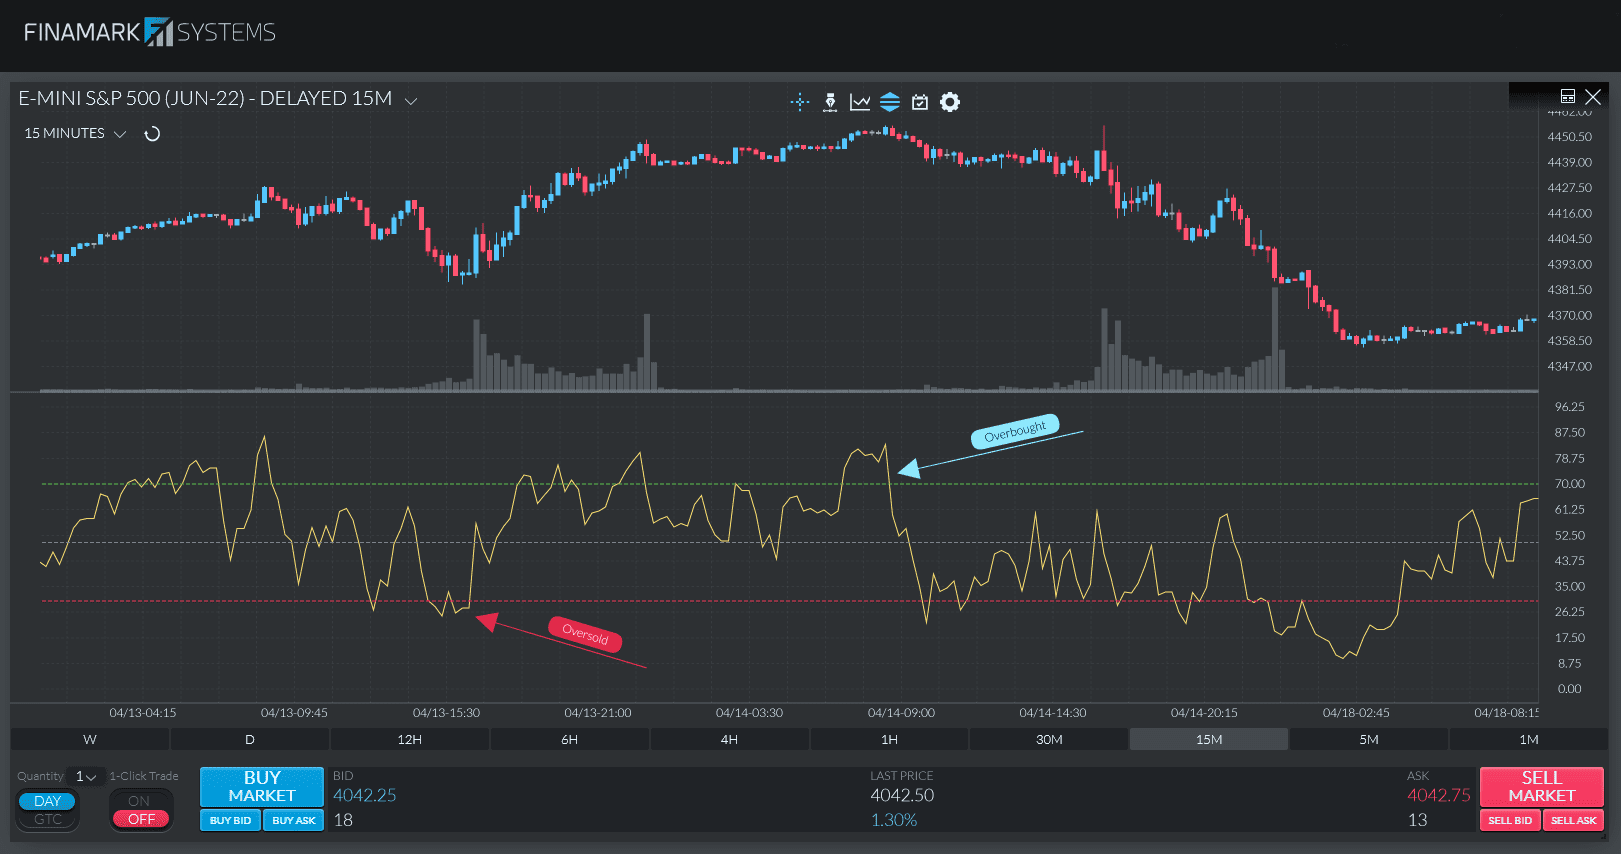
The RSI is a very straightforward yet among the most powerful technical trading indicators. It can serve both as a leading and a lagging indicator. The RSI helps day traders identify when the price enters overbought and oversold market conditions, thus when the trend is likely to change course.
On a chart, the RSI appears as a line that runs between 0 and 100. Based on how the RSI line converges or diverges in relation to price data, traders decide when to take long and short positions.
The essential ranges to remember here are 0 and 30 (the oversold zone) and 70 and 100 (the overbought area). When the indicator is in the overbought zone, it signals that the buying pressure is easing, and the price might soon drop. On the other hand, when the price is within the oversold range, it signals that the instrument might be undervalued and that bulls will soon take over. With that in mind, make sure to observe the behavior of the RSI line – when and how it moves across those zones.
How to Take Short and Long Positions with the RSI
The basic interpretation of RSI trading signals is as follows:
- Sell when the indicator climbs above 70 and falls back below it
- Buy when the indicator falls below 30 and rises back above it
However, take into account also the context of the situation. For example, if the price is forming a solid uptrend, it is better to ignore the oversold signals, opposing the current trend development until a corresponding reversal is confirmed.
Also, bear in mind that the RSI often generates failure swings where the RSI surpasses the 70 mark, drops below it for a while, and then surges back above without crossing the overbought threshold. Such developments are considered strong confirmations of an upcoming trend reversal.
Find out more about the RSI and how to incorporate it into your trading strategy in our in-depth guide.
Moving Average Convergence Divergence (MACD)
The Moving Average Convergence Divergence (MACD) is the ultimate moving average indicator. It is constructed by subtracting a 26-period exponential moving average (EMA) from a 12-period EMA. The MACD is the main, slower line, while the faster one is the signal line. The indicator also has a histogram, representing the difference between both lines.
The MACD is an example of a lagging momentum indicator that day traders often use to plan their next moves.
By looking at the lines of the MACD, day traders can timely spot crossovers, convergence, and divergence price movements. That way, they can get a sense of the trend’s strength and where it is likely headed next.
How to Take Short and Long Positions with the MACD
There are several ways to interpret MACD signals. Here are the most common ones:
Crossovers
A crossover happens when the MACD lines cross. There are two basic types of crossovers – a signal line crossover and a zero line crossover.
The signal line crossover is the most common signal of the MACD. It occurs when the MACD line crosses above or below the signal line. A bullish signal line crossover can be observed when the MACD line crosses above the signal line. On the contrary, a bearish crossover occurs when the MACD line crosses below the signal line.
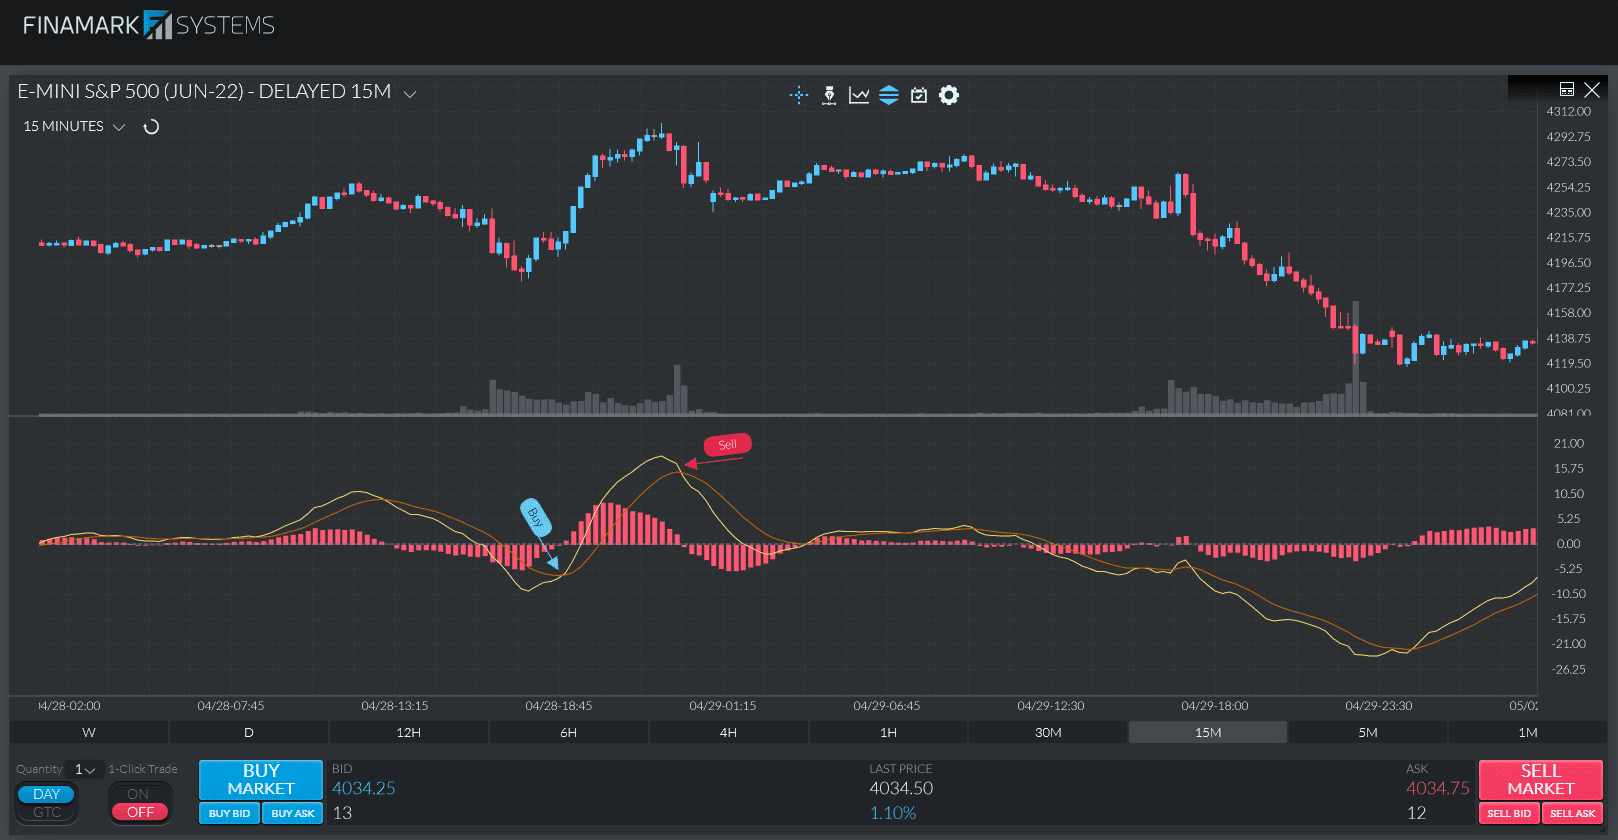
The zero line (centerline) crossover happens when the MACD line crosses the zero line and becomes either positive or negative. When the MACD crosses above the zero line and becomes positive, we have a bullish crossover. If it crosses below it and becomes negative, we have a bearish crossover.
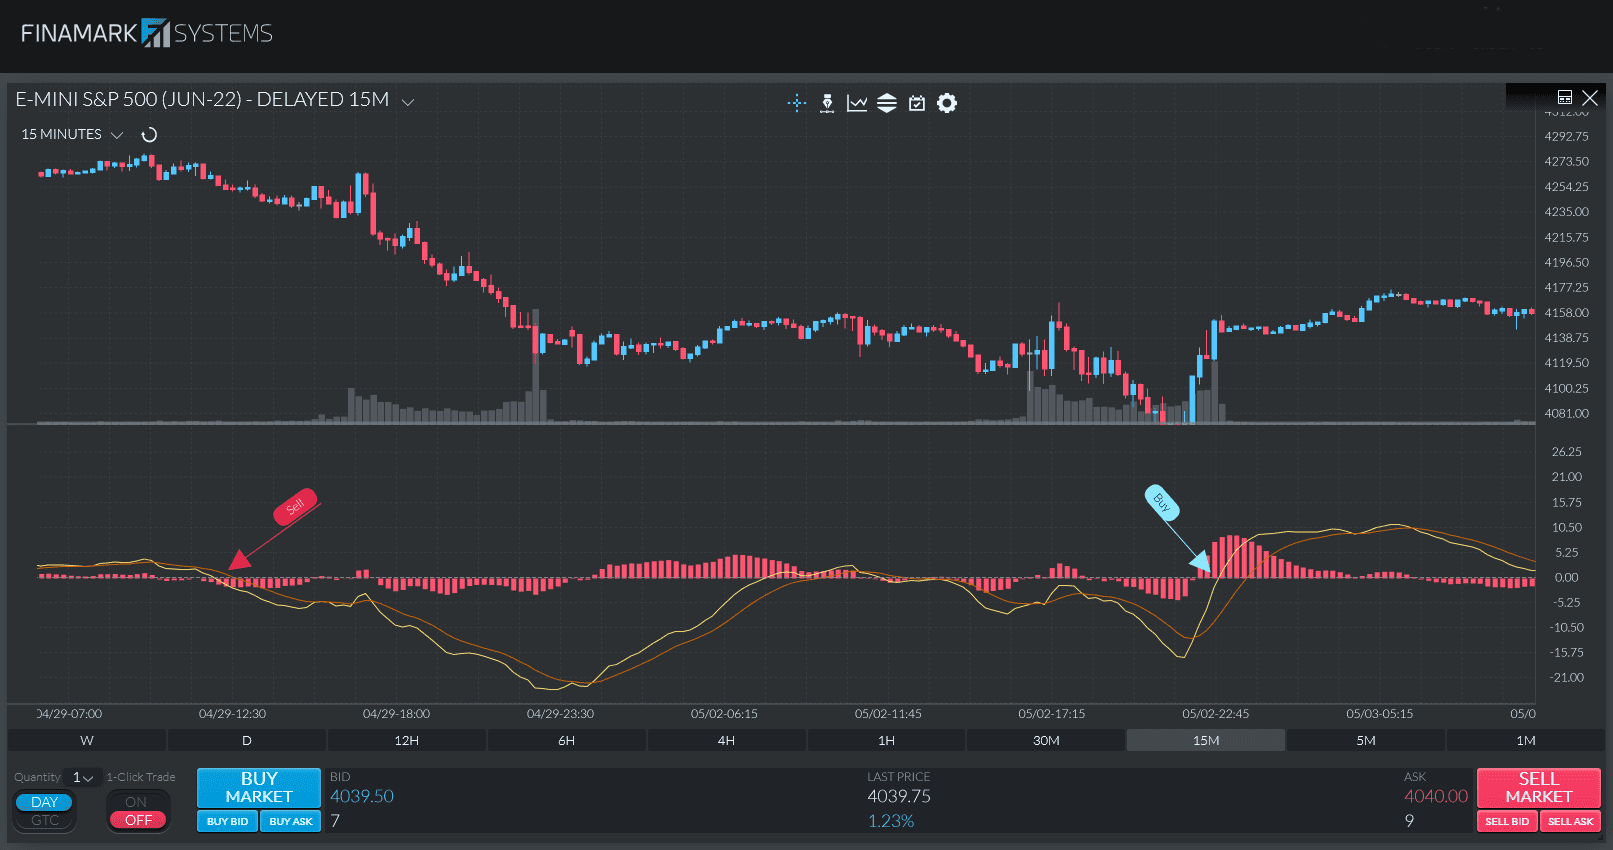
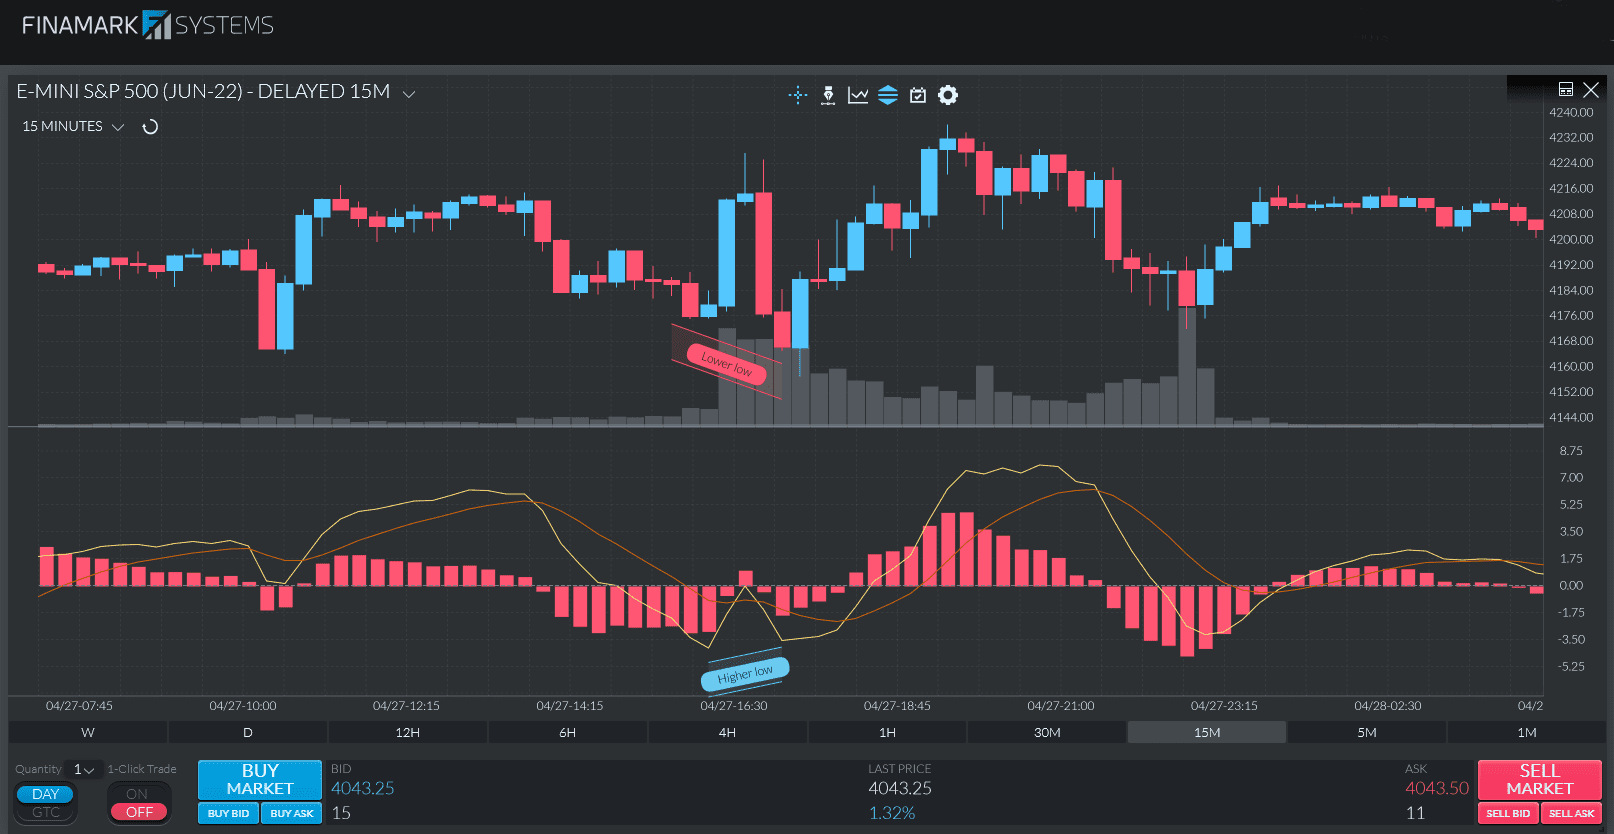
If the MACD marks an uptrend reaching higher highs and higher lows, as well as breaking key levels of resistance – traders can enter long positions. On the other hand, if there is a downtrend, meaning there are lower highs and lower lows and breaks of the support levels, traders might enter a short position.
Convergence and Divergence
Convergence describes a situation where the MACD line and the price get closer to each other, while divergence is when they move away from each other.
There are bullish and bearish convergence and divergence signals. A bullish divergence is when the price hits a lower low while the MACD hits a higher low. A bearish divergence is when the MACD hits a lower high while the price hits a higher high.
You can learn more about how to set up and use the MACD in our dedicated article.
Stochastic Oscillator
The stochastic oscillator is a momentum indicator reflecting the closing-price trends. It is a highly accurate buy and sell indicator and an excellent tool for identifying overbought and oversold signals.
The indicator is range-bound, with a minimum value of 0 and a maximum one of 100. It has two lines – the K line and the D line. The former is faster than the latter. The indicator’s interpretation is straightforward, making it a great choice even for beginners.
While the signals from the stochastic oscillator are pretty accurate, it is always good to confirm them with an additional tool like the RSI, for example.
How to Take Short and Long Positions with the Stochastic Oscillator
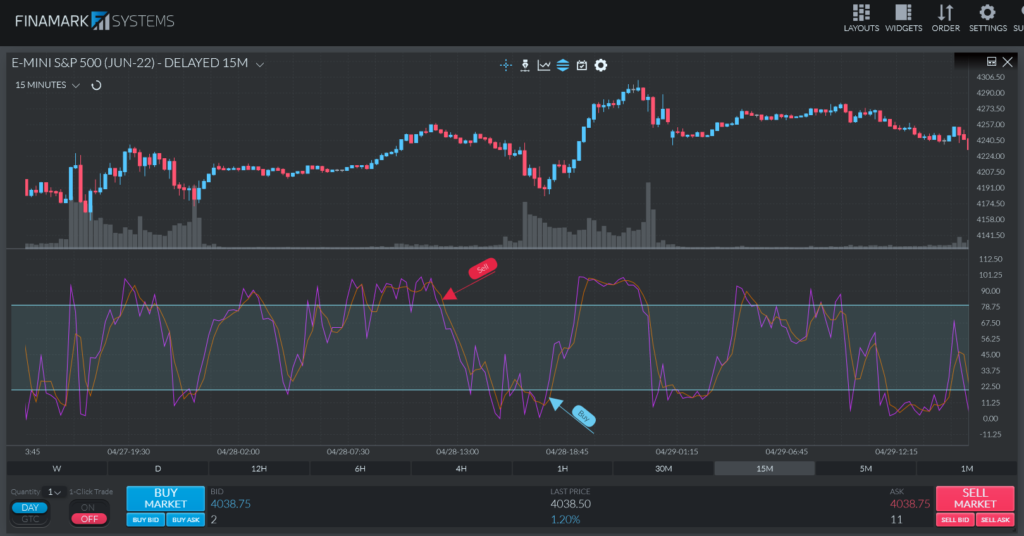
Traders need to watch the D line and the price. Especially when both begin to move into either the overbought (over the 80 line) or the oversold (under the 20 line) positions.
The basic idea is that you can sell when the indicator’s line crosses the 80 level from above. On the other hand, buy signals are when the indicator crosses the 20 level from below.
Many traders often use the indicator also to spot potential price reversals. To do that, they look for divergences. When the price makes a lower low, but the stochastic makes a higher low, the result is a bullish divergence. On the other hand, if the price hits a higher high but the stochastic makes a lower high, we have a bearish divergence. The trading scenario here is the same as with the MACD, which we discussed above.
Expert traders also use the stochastic oscillator to identify crossovers. However, without the needed expertise to interpret the market signals, such a strategy can result in trading on many false signals. Furthermore, the indicator crossovers are lagging and can lead to numerous whipsaws.
Find out more about the Stochastic Oscillator in our dedicated article.
Bollinger Bands
Bollinger Bands is a day trading tool that both professional and beginner traders favor. It is a great indicator to help determine entry and exit points based on overbought and oversold market conditions.
The indicator comprises three lines. The middle line is usually based on a 20-day simple moving average (SMA). The upper one is calculated by taking the middle band and adding twice the daily standard deviation. Following the same logic, the lower band is based on the center band minus two times the daily standard deviation.
Bollinger Bands is one of the most preferred indicators in the toolbox of traders interested in small and continuous gains. It is the most popular volatility-measuring indicator and one of the most complete ones. At the same time, it is very simple to interpret.
The indicator gives you a range within which the asset’s price typically trades. Based on the recent volatility, the width of the band increases and decreases. The wider the bands are, the bigger the volatility. And vice-versa – if the bands are close to each other, the volatility is lower.
How to Take Short and Long Positions with the Bollinger Bands
The indicator can help predict long-term price movements – for example, when a price continually moves outside the upper band, the market can be overbought. On the contrary, when the market is constantly moving outside the lower band, the market might be in an oversold condition.
Thanks to this, you can timely spot looming breakouts and identify when the current trend is running out of steam simply by monitoring the distance between the upper and lower bands.
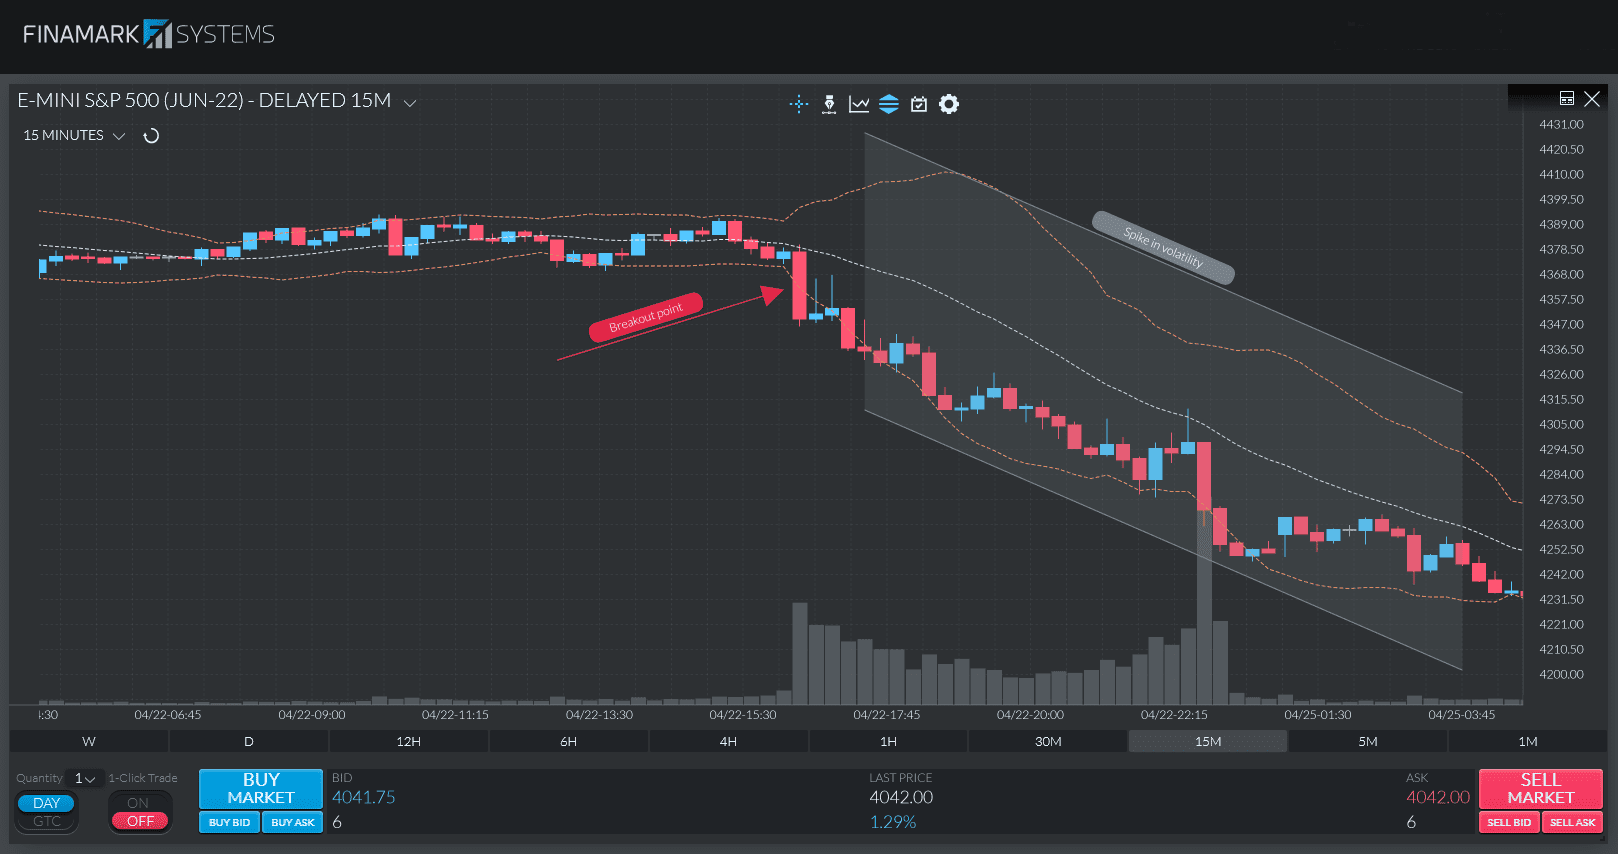
When the distance between the upper and lower bands is narrow, the market consolidates. Alternatively, the market is “squeezing” the price, and breakouts might be around the corner.
Once the price moves above the high of the consolidation, you have an upside breakout, while when the price closes below the low of the consolidation, you have a downside breakout. Also, it is essential to have the upper and lower band starting to widen (an indication of a volatility spike) in a breakout scenario for further confirmation that the consolidation moves into a new trend.
However, taking short and long positions with the Bollinger Bands can often be tricky. It is advisable always to keep the overall direction of price in mind and only take trade signals that align with it.
Learn more about the indicator in our in-depth article.
Final Thoughts on Indicators For Day Trading
You and millions of others look at the same charts every single day. You and millions of others use some of the most popular trading indicators like the RSI, MACD, Stochastic, and more. So, how can you rise above the competition? The answer is by mastering the way you are using those indicators. This guide is a good starting point for how to take short and long positions with some of the most popular indicators.
However, it is advisable to start learning about the different indicators one by one and explore all the purposes they can serve. Whether it is for identifying overbought or oversold market conditions, convergences or divergences, or else, the buy and sell signals can be very different. Learn that difference, and you will lay a solid foundation for your day trading career.