Many new traders fail because they can’t withstand the pressure associated with market instabilities. They can’t because they lack self-control and don’t have an adequate risk management strategy in place. One of the first things you should learn is how to control your drawdown. Avoid letting it get in your way and you will become a more successful trader. In this guide, we will learn more about drawdown in trading. We’ll also examine how it works, and how to effectively control it in your Earn2Trade funded trading account.

What is a Drawdown?
A drawdown in trading refers to the degree to which your trading account or a particular investment drops down from their peak, before recovering. In other words, a peak-to-trough (swing low) decline during a specific period.
We calculate it as a percentage between the peak and the following trough. However, in the case of the trading account value, we can also report the drawdown as a dollar sum. For example, if the $1,000 inside your trading account drops to $900 and then moves back and surpasses $1,000, the drawdown is 10% (or $100).
If the instrument’s price or the value of your account drops below the peak but then fails to get back, you can expect a new, lower trough. Troughs only become recognizable after there is a new peak.
That is the reason why we record drawdowns right after the price gets back to the peak ($1,000 in this case). Otherwise, if there is a lower trough, then it might increase.

You might also enjoy:
- Support and Resistance │ A Basic Concept of Technical Analysis
- Bitcoin Futures Explained – Learn How to Trade Bitcoin Derivatives
An Inevitability of the Financial Market
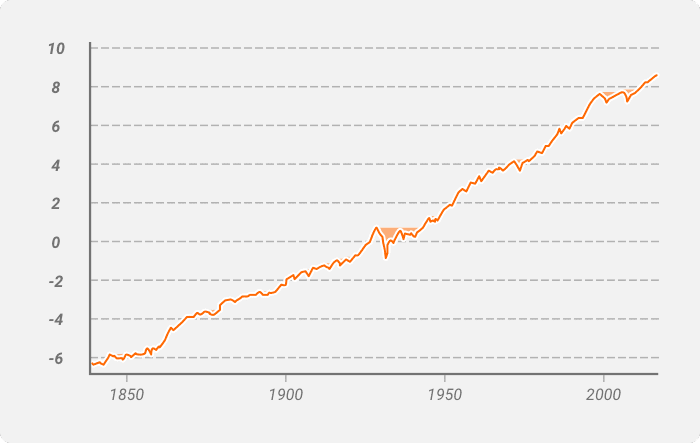
Drawdowns are an inevitable part of financial markets and more common than you might expect. According to some estimates, the S&P 500 has a 5% to 10% drawdown approximately 12.8% of the time.
In addition, over an almost 200-year period of market history, investors had been in a drawdown 74% of the time. More than 40% of these drawdowns exceeded 20%.
If the market has so many drawdowns, then it is normal for your trading account and the assets in your portfolio to have them. You simply can’t run away from it.
This isn’t a bad thing, though. If you learn how to manage them and adopt adequate risk management strategies, you can reduce the effect such situations have on your trading performance.
“Unless you can watch your stock holding decline by 50% without becoming panic-stricken, you should not be in the stock market.”
– Warren Buffet
What is a Drawdown in Trading?
Drawdowns in trading are important because they help traders measure the historical risk of instruments or evaluate their performance.
For example, the drawdown of an ETF, futures contract, or a stock can indicate how risky and volatile the instrument had been in the past. That way, traders can better identify whether the particular instrument fits their risk tolerance and investment goals.
In the context of trading, we can also describe drawdowns as downside volatility. The bigger it is, the more volatile the particular instrument had been (and will likely continue to be).
When analyzing drawdown from the perspective of an instrument’s price or an account’s value, it is essential to note that the time it takes to recover from the drop is another key characteristic.
The quicker the instrument regains its price, the better it is for the trader. Understandably, that is also the case with trading accounts.
For example, if a particular instrument experiences a notable 10% drawdown and gets back to its peak in just a few seconds or minutes, then the most likely reason is a flash crash, which shouldn’t concern investors too much.
In general, however, a drawdown can take anywhere from a few trading hours to several months when it comes to the market.
It’s not the same as a loss
Don’t confuse a drawdown with a loss. A drawdown is a temporary peak-to-trough metric, while the loss is calculated based on the purchase price relative to the instrument’s current or exit price.
However, we often also refer to drawdown as “unrealized loss.” As you can see from the chart above, the drop is temporary. It is registered once the price hits its second peak and closes the drawdown.
When reading professional trading guides or threads on trading forums, you may see others using the term “performance drawdown.” However, it is just another way to refer to a particular trader’s drawdown strategy over a certain period of time.
Understanding How a Drawdown Works
To understand how it works, we will analyze both contexts it is applied in.
Let’s start with drawdown as a measure of an asset’s financial risk. In this context, the drawdown is basically the negative half of the standard deviation in relation to a particular instrument’s price.
Here is an example. Let’s assume that AAPL trades at $300. It drops $15 to $285 and then gets back to $300.01. The drawdown, in this case, is 5.00%.
In the context of the trader’s account, the drawdown is calculated as a temporary drop in the value of the account that is regained afterward. For example, if you have $50,000 in your account and lose $5,000, but then the portfolio regains its value and surpasses the $50,000 mark, you have a 10.00% drawdown.
Now, after you are familiar with how it works, it is essential to understand how to use it to evaluate investment opportunities.
How big of a risk a drawdown is for investors depends on its scale. For example, while a 1% drop in a stock’s price requires simply a 1.01% rebound to get past its previous peak, in case the drawdown is bigger, it turns into a significant risk for investors.
If the market drops 20%, it has to hit a 25% increase to get back to its previous levels. A 50% drawdown translates to a 100% increase, required for a full recovery. And the truth is 50% drawdowns aren’t impossible. The last time we witnessed such a scenario unfold in a major market was during the Financial Crisis of 2008.
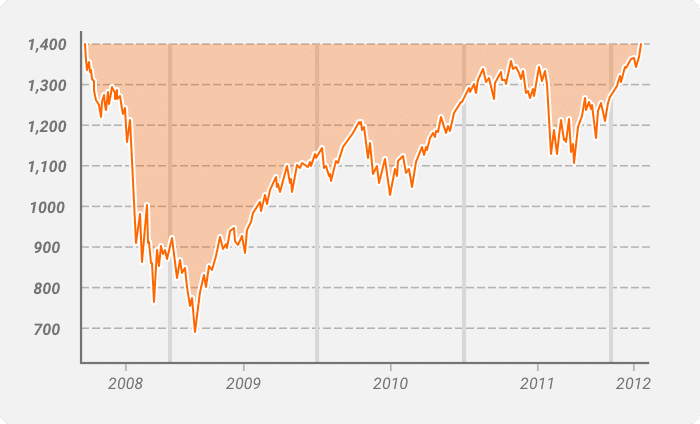
Market Downturns after 2008
In the chart below you can see another example of an S&P 500 drawdown, taking place between June 2008 and March 2012. With a length of three years and nine months, the drawdown hit the lowest point of -52%.
A general rule of thumb for investors is to avoid instruments with drawdowns higher than 20% – 25%.
It is also essential to take a look at how drawdown can help you evaluate a trading strategy and its performance. Bear in mind that a trading strategy with 10% profitability and a maximum drawdown of 2% is better than one with 20% profitability and 20% drawdown.
Institutional investors need to take this into account since the ticket size of their investments is huge.
However, bear in mind that relying on drawdown alone isn’t a viable strategy. It can vary from instrument to instrument and cannot reflect the effect on price based on political stories, market news, governmental policies, etc. Besides, it doesn’t take into account random variations in stocks or funds.
Examples of Drawdown in Trading
In the example below, we are looking at a weekly chart of the E-Mini S&P 500 futures contract. There are two consecutive drawdowns marked with green rectangular.

The first drawdown starts from the peak marked with A and then hits a trough marked with B. Then the price proceeds to surpass the previous peak and conclude the drawdown at point C.
It’s the same case with the second drawdown. After the initial peak (X), the price hits a trough (Y) and then goes on to surpass the first peak (Z).
As you can see, the first drawdown takes two months to complete. Meanwhile, the second lasts three months and a half.
When trading, drawdowns can take anywhere from a few minutes to several months or even years.
It is hard to predict the magnitude of a drawdown. The best thing you can do is adopt a proper risk management strategy to protect your investment portfolio.
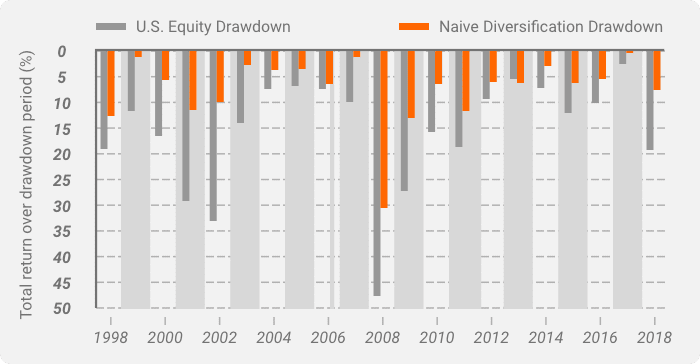
Experts suggest that you can mitigate the effect of a drawdown by maintaining a well-diversified portfolio. This includes a wide range of instruments like stocks, bonds, commodities, cash, precious metals, etc. When constructing it, make sure to look at the potential constituents’ historical volatility to avoid including assets with high drawdowns.
Analyzing Historical Data
Below is data from Bloomberg, S&P, MSCI, SEI, and Bloomberg Indexes. It shows how simple diversification can help better navigate drawdown periods. The employed naive diversification strategy is equal-weighted. More information on the constituents is available here.
To better protect your investments from drawdowns, it is also essential to analyze the situation in perspective. Although no one knows how long a drawdown may take, you can, at least, plan your goals and adjust the maximum possible drawdown based on your investment horizon.
For example, suppose you are just starting your career or have more than 10 – 15 years to retirement. In that case, a drawdown of 20% might be viable because, for that time length, your portfolio will most probably be able to recover from potential negative impacts.
On the other hand, individuals close to retirement should look at portfolios with as low drawdown as possible to ensure their capital is protected.
What is a Maximum Drawdown?
A maximum drawdown is the maximum range (move) between a peak and a trough of a portfolio. It is measured as a percentage or as a dollar amount in the case of trades/value.
Investors use maximum drawdown (MDD) as an essential metric to evaluate the downside risk associated with a particular investment over a period of time. They use it either as a standalone metric or incorporate it into more complex concepts like Return/MDD.
The maximum drawdown takes into account only the magnitude of the largest drawdown. It doesn’t consider the frequency of big losses or how much time it takes for the price to get back to its peak.
The concept of MDD is intended to provide investors with a clearer picture of a particular investment opportunity’s capital preservation potential. For example, if the trader compares two stock screening strategies with equal performance and volatility, he will choose the lower MDD.
A low maximum drawdown is preferred because it means the potential losses of a particular investment are lower. On the other hand, an MDD of 100% means investing in a specific instrument is pointless.
Using Benchmarks
When analyzing a particular investment opportunity, it is essential to examine the MDD in a benchmarking context.
Example 1
Let’s say you consider investing in a fund with a 30% maximum drawdown for the period 2000 – 2010. At first sight, this might seem like an extremely risky investment. Next, you take a look at the S&P 500 for the same period, and you see that its MDD is over 50%.
This puts things into perspective and shows that the fund has massively outperformed the index in terms of MDD. What you first considered as a risky investment proved to be a safer bet than the global benchmark for a particular period.
Of course, this won’t always be the case. You should never invest in an instrument based solely on its MDD. There are numerous factors at play, and MDD is only one of them. What this comes to show is that you should always analyze drawdown in comparison to a benchmark.
Example 2
If you are trading stocks, use the S&P 500, Dow Jones Industrial Average, or another index. If you are trading currencies, use a dollar index for comparison.
Besides, to get actionable insights, you should always expand your analysis by comparing the maximum drawdown to the maximum drawdown duration. In fact, it is worth noting that the duration of a drawdown often is more painful for the trader than its magnitude. A 20% drawdown lasting a few months is bearable. But when it lasts years, it can really put your nerves to the test.
Use the maximum drawdown to better forecast the worst-case scenario for your trades. Keeping this in control will help you become a better performing trader.
Example of a Maximum Drawdown
Assume that you have an investment portfolio with an initial value of $100,000. Over time, it grows to $125,000. Due to some unfavorable market circumstances, it drops to $80 000, just to rebound to $90,000 and fall back to $70,000. Next, the portfolio’s value skyrockets and doubles to $140,000.
Now, before you rush calculating percentages, we should clarify several things. This seems like a series of events that may complicate the calculation of MDD. However, the truth is you don’t have to incorporate all price points in your calculation.
You have to consider only the initial peak ($125,000) and the lowest drop ($70,000). The last peak ($140,000) is irrelevant because the only important thing here is that the initial peak was surpassed. It doesn’t matter whether your portfolio has surpassed $125,000 with a single penny or $15,000.
In addition, the interim peaks and lows ($80,000 and $90,000) aren’t taken into account. That’s because they don’t surpass the lowest or the highest price points.
The formula to calculate the maximum drawdown is:
MDD = (Trough Value – Peak Value) / Peak Value
Considering the values from the example above, in the end, the MDD for the given scenario will look as follows:
MDD = ($70,000 – $125,000) / $125,000= -44.00%
Now, if you are an investor and especially a retiree seeking stability for your capital, you would like to consider the MDD of your investments. Analyze several opportunities, be it a mutual fund, a stock portfolio, or else, and put more emphasis on the one with a lower MDD (of course, in addition to other essential metrics like performance, fees, etc.).
To better understand maximum drawdown, let’s analyze it also in the context of trading profits.
A Theoretical Case Study
Let’s say that during today’s trading session, Joe opens five trades.
- 1st Trade – a profit of $20 with a maximum drawdown of $10
- 2nd Trade – loss of $10 with a maximum drawdown of $35
- 3rd Trade – loss of $50 with a maximum drawdown of $60
- 4th Trade – a profit of $40 with a maximum drawdown of $25
- 5th Trade – a profit of $55 with a maximum drawdown of $30
At the end of the day, Joe’s gain is $55, with a maximum drawdown of $60 (the one in Trade 3).
The scenario above is an example of a suicidal strategy because the maximum drawdowns are very high. In the end, Joe gets lucky and ends up on the winning side. However, the next time things might not be so favorable. If the maximum latent loss on a single trade still exceeds the total performance for the trading session, Joe might get his portfolio wiped out quickly.
That is why it is essential to always keep an eye on the maximum drawdown of your investments. Think of it as a crucial cog in your risk management strategy. In the end, this can make the difference in whether you navigate the markets successfully or you lose your capital.
How the Drawdown Works in Funded Trading Accounts
The benefits of funded trading accounts are numerous, and we have talked about them extensively in our dedicated guide.
Here, we will take a different perspective and explore what drawdown means in the context of funded trading accounts and how important it is for your performance.
Before that, we should focus on the meaning of the term “trailing drawdown.”
When you look at the different account tiers on our GAUNTLET MINI™ program, for example, you will see that each of them has a specific trailing drawdown limit.
The trailing drawdown is pegged to the positive account performance. Alternatively – if you earn a profit of $5.00, your trailing drawdown will also increase by $5.00. It follows your positive trading performance and adjusts based on your profits.
To make it clearer, let’s take a look at a real example. The $50,000 GAUNTLET MINI™ account has a trailing drawdown of $2,000. If you make $200 on your first trade, your account balance will rise to $50,200. The trailing drawdown will follow and adjust to $200. Then the drawdown level will effectively become $48,200.
If you end up in a series of winning trades and surpass the $52,000 mark, the drawdown level will equal the value of your initial account ($50,000). At that point, it will stop trailing above it and remain fixed.
On the other hand, if you register losses that end up eating your trailing drawdown limit and your account value reaches or falls below the $48,000 mark, it will be liquidated.
To find out more about it, make sure to check out this article from our Help Section.