
In this article, you’ll learn about the Moving Average Convergence Divergence indicator, or MACD for short. It’s one of the most popular and widely used technical analysis tools. We’ll explore everything about the indicator from the way it’s calculated, through how to read it properly, to how you use it when trading live.
The MACD indicator can help you spot powerful signals like a crossover or a divergence. Learning to use it for accurately predicting the formation of new trends will significantly improve your trading. The start of a trend is usually where most of the money is made after all.

What is MACD?
The MACD is a trend-following momentum oscillator applied to the price of a particular security using two moving averages to attempt to indicate the formation of a new trend.
On a chart, the MACD is visualized as two lines, oscillating without boundaries. The shorter line is a 12-period Exponential Moving Average (EMA) that moves quicker and is responsible for the majority of the MACD movements. The longer one is a 26-period Exponential Moving Average that reacts more slowly to price changes.
To completely understand what the Moving Average Convergence Divergence is, we should also take a look at the reason why it is so popular among traders. Due to being unbounded and despite being a momentum oscillator, it isn’t used to identify overbought or oversold markets. By combining two trend-following Exponential Moving Averages and turning them into a momentum oscillator, the MACD basically combines the best of both worlds and serves as a trend-following indicator and a momentum indicator at the same time.
The EMAs gravitate around the zero line and occasionally cross, diverge, and converge. By monitoring these movements, traders can recognize key trading signals like a divergence, a centerline, or a signal line crossover. This way, the indicator helps you see when a new bullish/bearish trend is about to form.

You might also enjoy:
- Relative Strength Index (RSI) – What is it and how to calculate it?
- Fundamental Analysis – A Complete Guide from Basic to Advanced
Origin
The Moving Average Convergence Divergence oscillator was developed by Gerald Appel in the late 1970s. Over time, the indicator established itself as one of the simplest and most effective technical analysis tools. It’s simple because when it is used, all that traders have to look for is the convergence and divergence of the two EMAs. When the lines move towards each other, it’s a convergence. When they move away from each other, then it’s a divergence.
MACD Formula
To calculate the MACD, we should get the values for the short- and long-term EMAs first. The idea of using exponential moving averages is because they put more weight on the most recent price changes (simple moving averages, on the contrary, apply equal weight to all price points). In the equation, the long-term EMA is observed over 26 periods, while the value of the short-term EMA is taken on the basis of 12 periods. Period refers to the time-frame you’re trading on, so for a daily chart it would be 12-day and 26-day EMAs respectively. Next, we have to subtract the long-term EMA from the short-term EMA and that gives us the Moving Average Convergence Divergence. To do that, we should use the closing prices for each period.
MACD line = 12-Period EMA – 26-Period EMA
The Signal line is another portion of the MACD indicator. As for its value, we use the 9-period EMA of the MACD line. Its purpose it to help generate trading signals by identifying when there’s a turning point in the trend. The final part of the indicator is the Moving Average Convergence Divergence histogram. It represents the distance between the MACD line and the signal line. If the MACD line is above the signal line, the histogram is positive, and vice-versa. More on this in the next paragraph.
How to read the Indicator?
To be able to understand the Moving Average Convergence Divergence in detail, it is important to be able to read its components on a graph. The indicator consists of three elements that move around the zero line: the MACD line, the signal line, and the histogram. Here is a bit more about each of them:
- MACD line (12-period EMA – 26-period EMA) – it helps traders determine upcoming bullish and bearish market trends;
- Signal line (9-period EMA of the MACD line) – it is analyzed in addition to the MACD line to help spot trend reversals and mark the most appropriate entry and exit points;
- Histogram (MACD line – Signal line) – the histogram provides a graphical representation of the convergence and divergence of the previous two, the MACD and the signal lines;
Each of these lines has a separate value. A MACD line with a positive value indicates that the shorter EMA is above the longer EMA. The further the shorter EMA is from the longer one, the bigger the increase in the positive value of the MACD line. This is an indication of mounting upside momentum. On the other hand, a negative MACD indicates that the shorter EMA is below the longer one. Once again, the negative values increase as both lines diverge further. In that case, we have an increasing downside momentum.
Depending on the movement of the exponential moving averages, the correlation between them can be either divergent or convergent. Divergence takes place when both are moving away from each other, while Convergence occurs when they are getting closer.
How to use the Indicator
The truth is that the Moving Average Convergence Divergence is among the most powerful forecasting indicators. That is why knowing how to use the MACD and how to interpret its signals can optimize the performance of your trading strategy.
The indicator can be used to identify three types of signals: signal line crossovers, zero line crossovers, and divergence. We will dive into each of them in the next sections.
Before that, we will focus on several things that you should be looking at when using the MACD:
- The crossing point – if the MACD crosses above zero, then the signal is bullish. If it crosses below zero, then it indicates that bears are overtaking the market.
- Where it turns from – if the MACD turns down from above zero, then this is a bear signal. On the other hand, if it turns up from below zero, then consider it a bullish signal.
- The direction of the crossing – if the MACD crosses from below to above, then the signal is bullish, and vice-versa. The further away from zero, the stronger the generated signal is.
Okay, that’s great, but what about the real trading signals? The hardest part to master with every trading indicator is finding out the best moments to place your buy and sell orders.
Signals
With the Moving Average Convergence Divergence, the primary buy sign to look for is when it crosses the signal line. What this indicates is that the momentum is shifting, and the bulls are taking over. There is also another buy signal triggered when the MACD is below the signal line, and both of them are below the zero line. If the MACD line then moves above the signal line, then you have a buy signal. Some traders wait for the MACD line also to surpass the zero line for further confirmation. It’s the same case when it comes to the sell orders. Once the MACD line drops below the signal line, a downside momentum shift occurs.
If you struggle to understand the MACD indicator simply by looking at both lines, then you can use the histogram instead. The explanation here is very simple – if the histogram is moving upward, you have a bullish signal, and you can buy. If it moves downward, you have a bearish signal, and you can sell. However, make sure to look also at the size of the bars. When the histogram is below zero, the bars turn upside-down. In that case, if they are getting smaller, it means the bears are weakening. However, make sure to buy only when the bars get above the zero line, although the more aggressive traders don’t always wait for such confirmation and act on the first signal.
Now, let’s expand on this a bit more. If the histogram is near the zero line, that means the two EMAs are close or even equal in numerical value. In situations where the bars get taller, the distance between the two EMAs is increasing. If the bars are shrinking, then the two EMAs are converging, and a potential signal change may occur.
MACD Settings – Setting Up MACD on Your Chart
Setting the MACD on a chart is an easy and straightforward task. On the chart, the MACD is displayed with three accompanying numbers (coordinates). The first indicates the number of periods used for the calculation of the shorter (faster) EMA. The second reveals the number for the longer (slower) EMA, while the third is the difference between both.
The standard settings for the MACD are 12, 26, and 9. Although, depending on the trader’s preferences, other settings can also be used, in the following example, we show how to set up a MACD with standard settings:
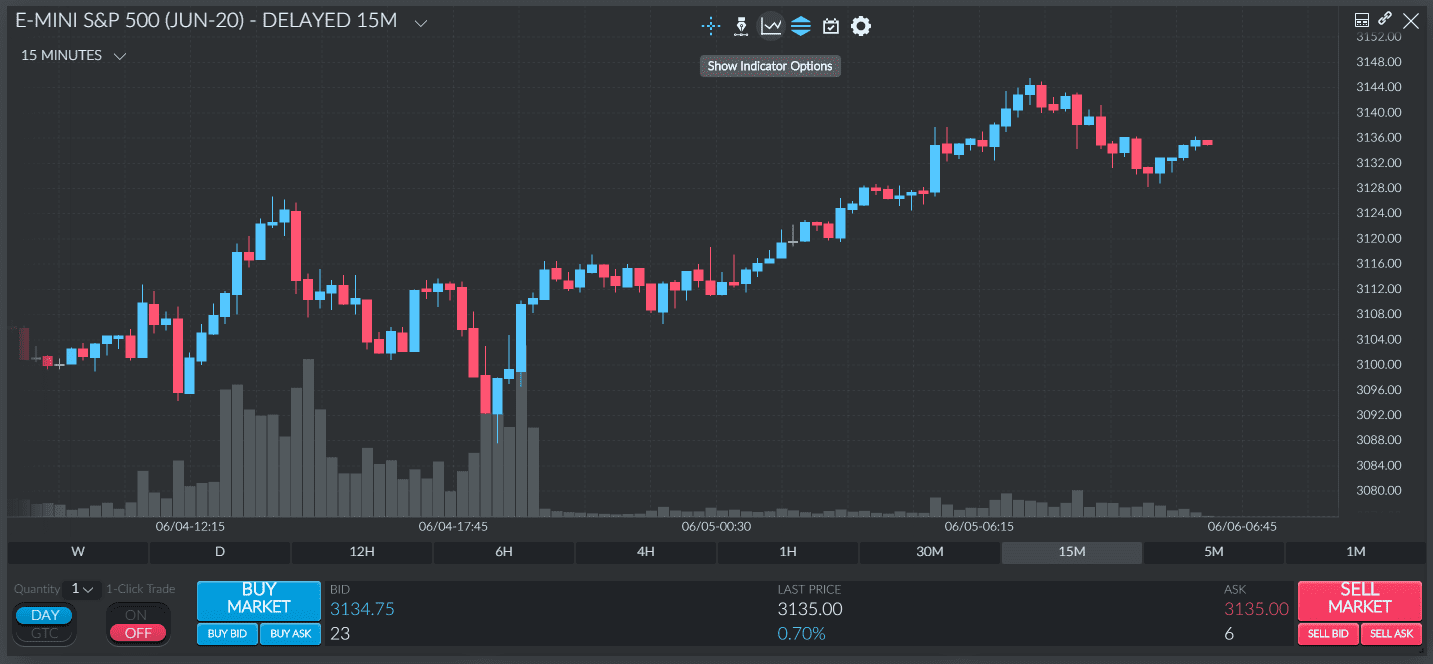
As an example, we will use the Finamark platform.
- First, bring up your charts and click the Indicator Options icon in the top-middle.
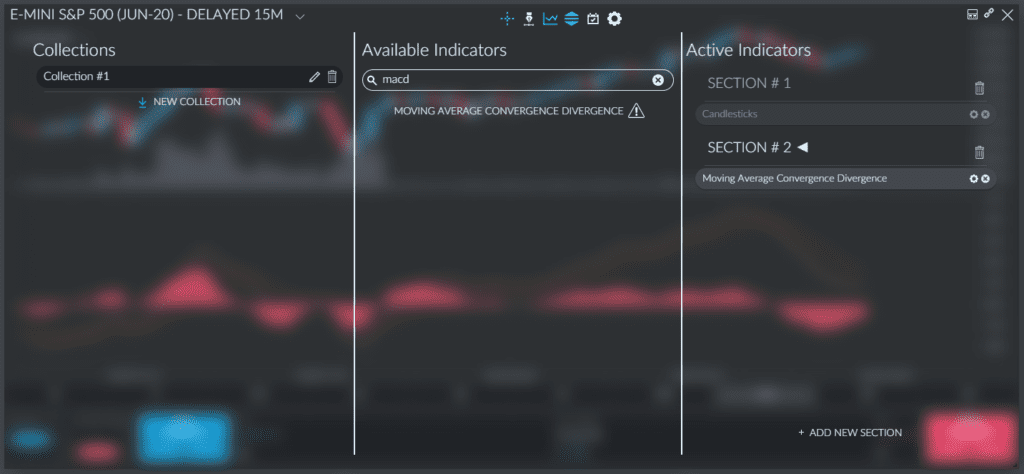
- Select your collection on the left, then add a new section on the right, and finally click MACD in the available indicators column in the middle.
This’ll add it to section 2 of your list of active indicators on the right.
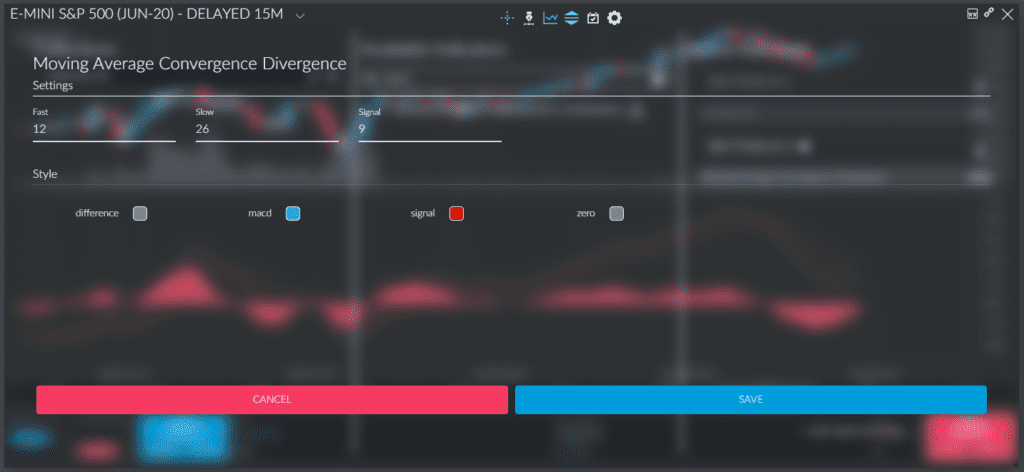
- Once it’s added to your active indicators, you can even customize the line colors and time periods as you see fit by clicking the gear icon.
Be sure to keep the default settings if you’re just starting out with this tool. In our case, we’ll change the settings to blue and red to better showcase the indicator.
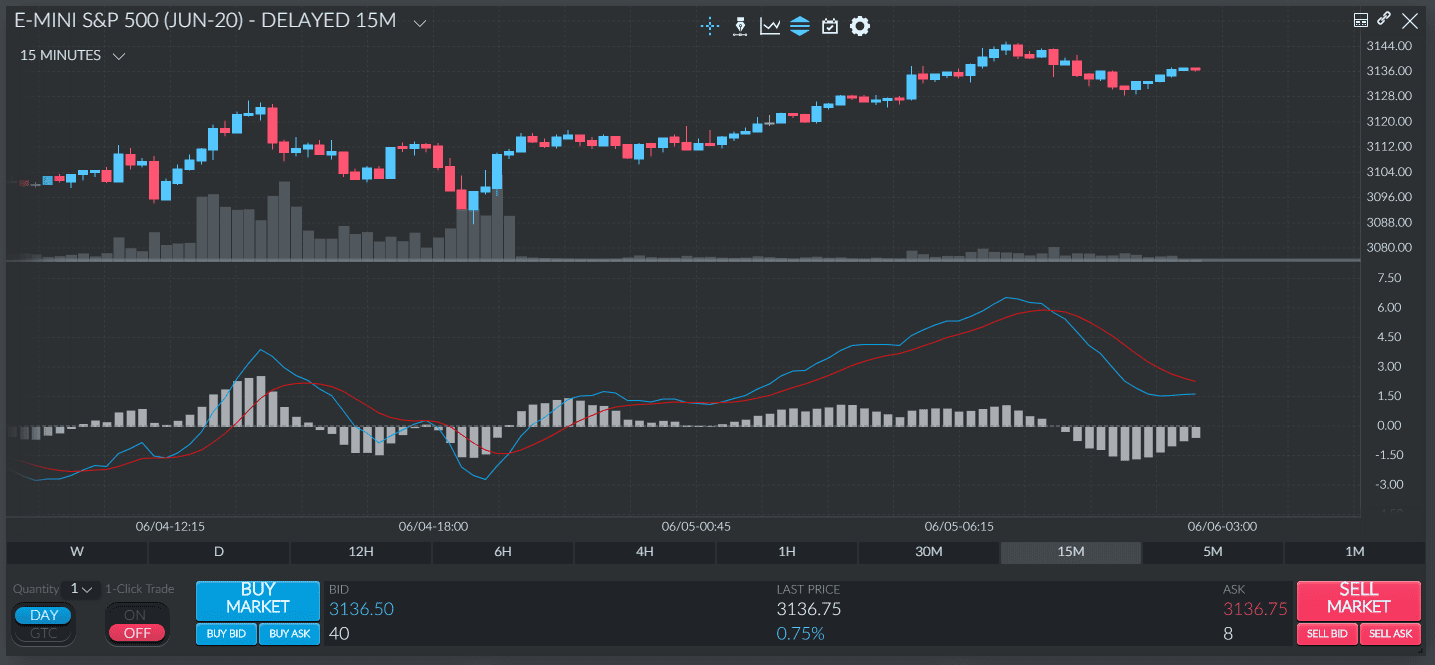
- You can now see the MACD right below the price chart. The indicator is added with its default settings (12, 26, 9), as seen below.
The yellow line indicates the MACD line. The orange line represents the signal line. The histogram is marked by the gray bars.
MACD Crossover
Crossovers are crucial signals that the MACD can help you identify. A crossover happens when the MACD line crosses above or below the zero or the signal line. The MACD can help you identify both the signal line crossover and the zero line crossover with relatively high accuracy. However, it is worth noting that the crossovers can produce multiple false signals per trading session, especially when it comes to highly-volatile assets.
Now let’s take a look at both types of crossovers and how they differ from each other:
Signal Line Crossover
This is the most common signal that the MACD can produce. Before we analyze it, it is important to bear in mind that the signal line is basically an indicator of an indicator as it calculates the EMA of the MACD line, which is the reason why it lags behind.
So, a signal line crossover takes place when the MACD line crosses above or below the signal line. The strength of the move determines how long the crossover will last. A bullish signal line crossover can be observed when the MACD line crosses above the signal line. On the contrary, a bearish crossover occurs when the MACD line crosses below the signal line.
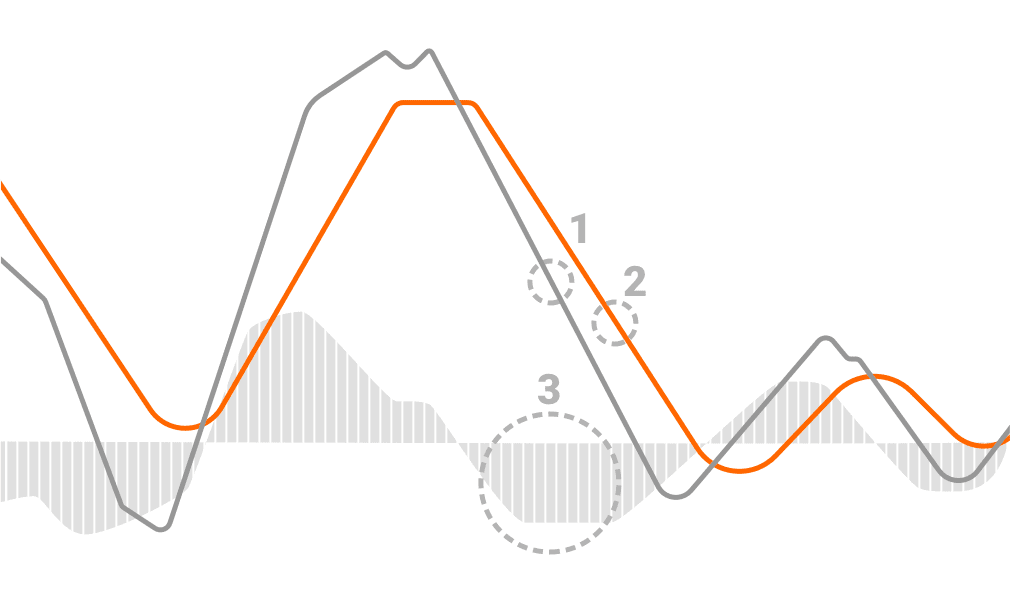
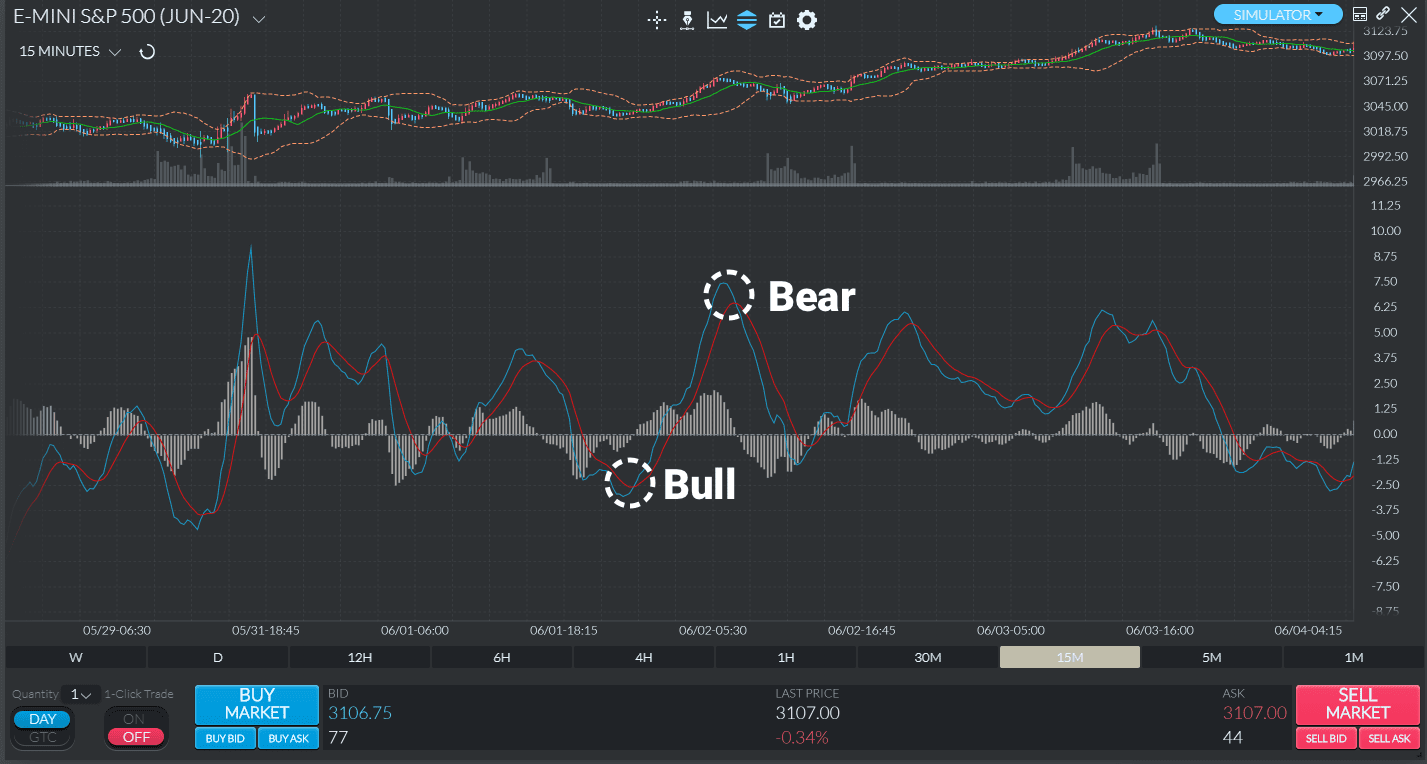
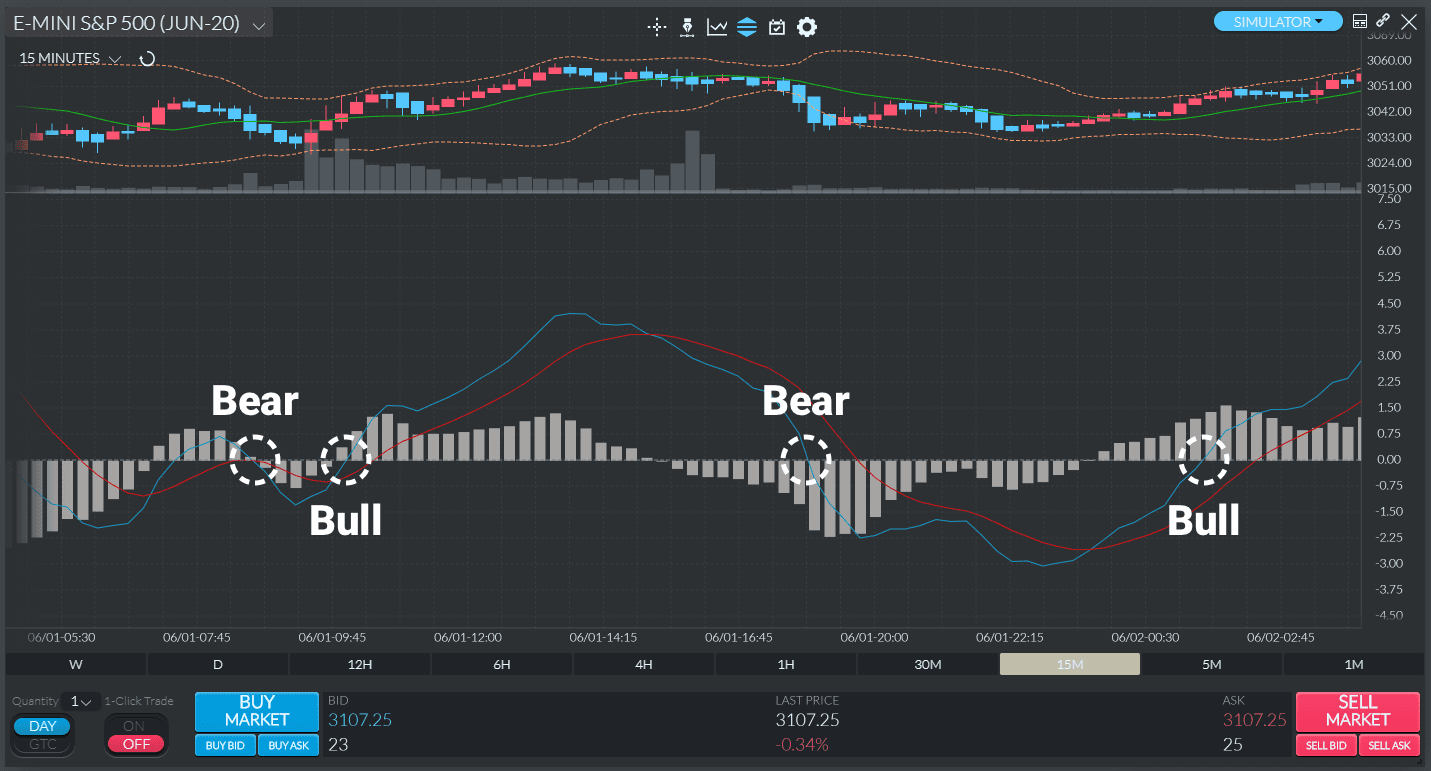
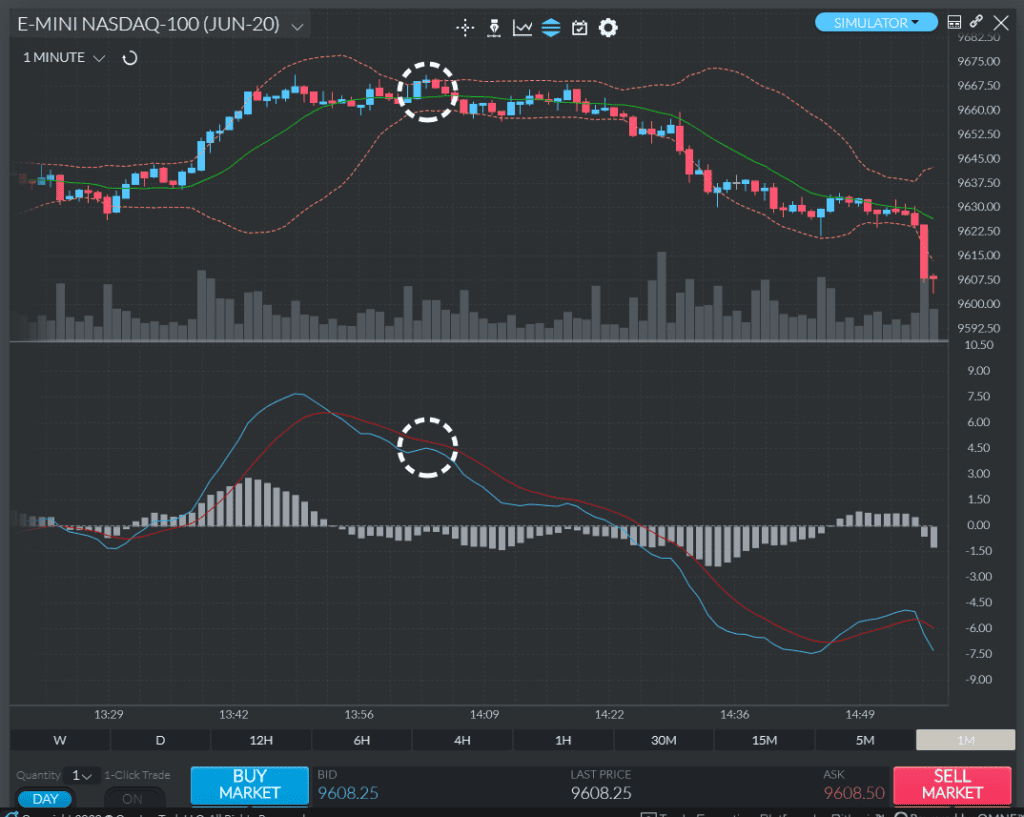
On the chart below, you will see two highlighted examples of bullish and bearish signal line crossovers taking place. The traded instrument is ES. The blue line is the MACD line, while the red line is the signal line.
Zero Line Crossover
The zero line crossover, also known as “centerline crossover” takes place when the MACD line crosses the zero line and becomes either positive or negative. If the MACD crosses above the zero line and becomes positive, then we have a bullish crossover. If it crosses below it and becomes negative, then we have a bearish crossover.
On the chart below, you will see examples of bullish and bearish zero line crossovers taking place several times during the observed period. The traded instrument is AAPL. The blue line is the MACD line, while the orange line is the signal line.
MACD Divergence
The other highly valuable signal generated by the MACD is the divergence. Divergence describes a situation in which the MACD line and the price of the instrument move in the opposite direction. Due to its limitations, you should analyze the MACD divergence cautiously and always in addition to other signals. That is because it can often produce false positives (i.e., indicate a potential trend reversal which never materializes afterward). Aside from that, it rarely manages to predict all reversals that take place. In a nutshell, the MACD divergence can predict a number of reversals that don’t happen, as well as miss out on the real ones.
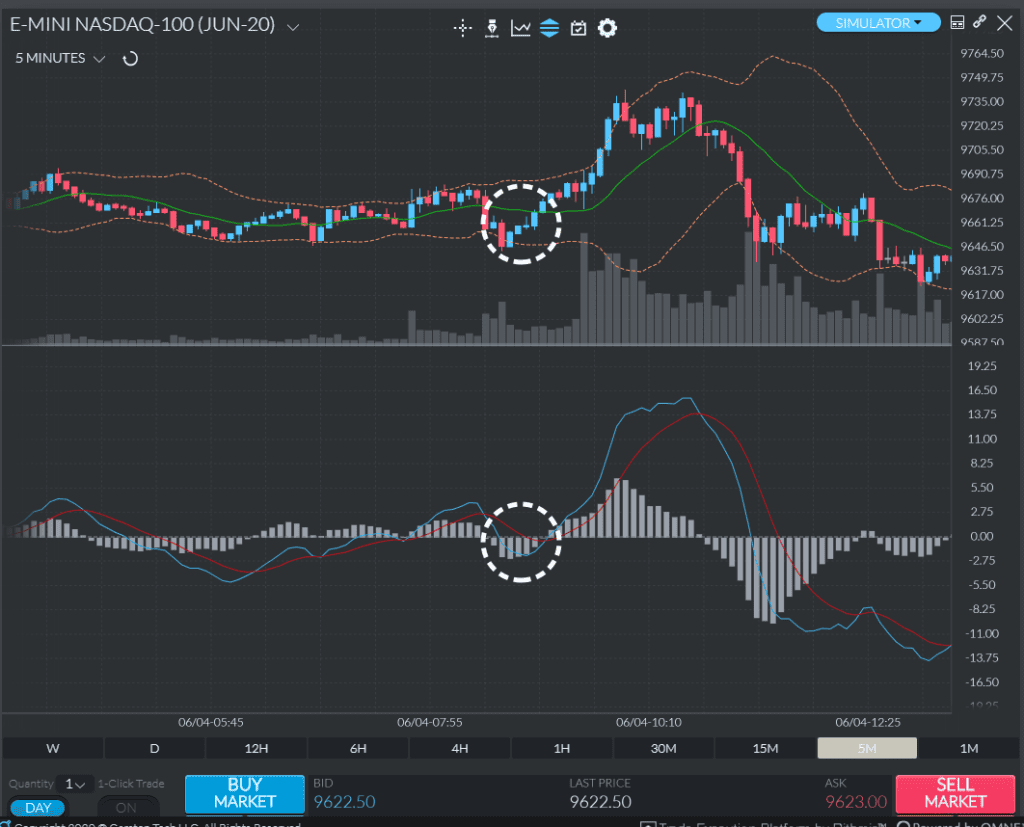
There are two types of MACD divergence – bullish and bearish. A divergence is bullish when the price of the instrument records a lower low while the MACD hits a higher low. Bearish divergence, on the other hand, describes a situation where the MACD records a lower high, while the price hits a higher high. Bullish divergences usually take place during strong downtrends, while bearish divergences occur in strong uptrends. On the charts below, you can see an example of both types.
F.A.Q
Yes, a positive MACD indicates a bullish signal. The MACD is bullish when the short-term EMA stands above the long-term one (i.e., when it is positive). On the other hand, when the MACD is negative, then we have a bearish signal. Don’t forget to take into account the distance between both EMAs, as well.
To predict a MACD crossover keep an eye on the position of and the distance between the MACD and the signal lines. The distance will quickly shorten right before a crossover takes place. Look at the histogram too. The closer it gets to the zero line (the smaller the bars get), the bigger the chance for a crossover to take place.
The numbers on the right of the MACD indicator chart are its settings. The default values are (12, 26, and 9) – 12 for the shorter EMA, 26 for the longer EMA, and 9 for the signal line. Depending on the trading software, as you are moving through the chart, on the right, you can also see their current values.
The Moving Average Convergence Divergence zero line, also known as “centerline” divides the positive area of the chart from the negative. The MACD line oscillates above and below it, which is how you predict bullish and bearish momentum. The indicator is positive when it is above the zero line, and negative when it is below it.
A negative MACD number means that the shorter (12-period) EMA is below the longer (26-period) EMA on the chart. A situation like this is indicative of increasing downside momentum. The bigger the distance between both EMAs, the bigger the negative number of the MACD line is.
It depends on the trading/charting software that you use. Usually, when you add the MACD indicator, you can adjust its settings. There is a separate tab for the histogram from where you can edit its colors, settings, or remove it entirely.