
Heiken Ashi (also spelled as “Heikin Ashi”) is a Japanese candlestick trading technique used to identify market trend signals and forecast price movements. This article will explore the Heiken Ashi technique, its pros and cons, how it is calculated, and more. We’ll also go over how to set it up on a trading platform in great detail. Most importantly, we will examine what trading strategies you can use it for and how to identify the buy and sell signals on a chart.

What is the Heiken Ashi?
The Heiken Ashi (HA) is a trading technique designed to average price data and form a candlestick chart that helps traders filter out the market noise. The result is a better representation of the market trend and the potential price movements. It is used to help traders identify when they should stay in a trade and when a pause or a reversal is about to occur so that they can adjust their positions.
The Heiken Ashi candlestick chart was developed in the 1700s by Munehisa Homma, whom we’ve mentioned before in our candlestick patterns guide. The term comes from Japan and means “average pace” or “average bar,” depending on the context. The idea is that the method represents the average pace of the instrument’s price.
The trading technique differs from traditional Japanese candles as it uses moving averages instead of open, close, high, and low prices. Thanks to that, the method generates smoother charts with easier-to-spot trends and reversals. Both advanced and beginner technical traders can use it.
You might also enjoy:
Understanding the formula
To calculate the Heiken Ashi formula, we use open-close data from the prior period and open-high-low-close data from the current period. This forms a more complete and functional candlestick indicator. The methodology is quite different from the way traditional candlestick charts are formed. In their case, only OHLC data is used. Let’s take a look at the formula:
Heiken Ashi Close = [Open(0) + High(0) + Low(0) +Close(0)] / 4
(values for the current period)
Heiken Ashi Open = [HA Open(-1) + HA Close(-1)] / 2
(values from the prior period)
Heiken Ashi High = Max [High(0), HA Open(0), HA Close(0)]
Heiken Ashi Low = Min [Low(0), HA Open(0), HA Close(0)]
The tricky part here is the calculation of the first HA candle. To do that, we should start by calculating the HA close price using high, low, open, and close data. The HA open is calculated based on open and close data. The high and low periods are the first HA high and HA low, respectively. After the first one is done, the next HA candles are calculated per the formulas.
The Heiken Ashi Chart
Many traders struggle to differentiate the Heiken Ashi chart from the traditional Japanese candlestick chart. It is understandable as both look very much like each other. To find out how to deal with both charts, let’s take a look at some examples:

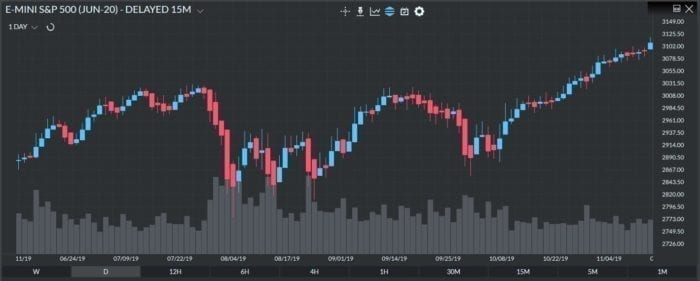
As you can see, the bars on the Japanese candlestick chart change from red to blue (bearish to bullish moves) very frequently. The reason for a significant part of these moves is just noise. This makes traditional candlesticks hard to interpret and often misleading.
The Heiken Ashi chart eliminates this noise, which helps it smoothen the directional moves. As the second chart shows, there are more consecutive bars of the same color. This helps distinguish price movements.
There is also a slight difference in how they use their colors. Heiken Ashi charts are usually blue when the price moves upwards and remain red when it goes down. On the other hand, traditional Japanese candles may change their color even when there are small isolated moves opposite the trend.
You can also differentiate both charts in the way open and close price information is displayed. In the case of Heiken Ashi candlesticks (for this example, we are using blue ones for better visualization), the new ones form at a level around the middle of the previous candlestick. However, when it comes to Japanese candles, the price starts from the level the previous one has closed.
The reason for this particular difference is the way both types of candlestick charts are calculated.
Heiken Ashi Strategies
The way this methodology filters the market noise and improves trading performance may sound good on paper, but how does this really work in practice? To find out, we will go through some of the most popular Heiken Ashi trading strategies and analyze real examples to help you understand how to apply them for your own benefit:
Identify A Strong Downside Or Upside Movement
The most common application of Heiken Ashi is to identify the moment when a trend reverses and takes on a new positive/negative movement. Due to the mechanics of the candlestick methodology, these signals are considered very reliable. A trader can ride the trend and be sure that the signal is trustworthy.
The example below shows two particular moments when the candles turn from red to blue. The common thing in both cases is that they are followed by strong upward movements.
Traders with short positions, in this case, might want to exit, while those with long positions will add to them.

As it becomes evident, the Heiken Ashi is rarely wrong. In the example above, Japanese candlesticks would have generated several misleading signals, which beginner traders might have fallen for and suffered losses.
Look For Candlesticks With No Shadows
This is one of the best-performing Heiken Ashi trading strategies. Candlesticks with no lower shadows are a highly probable signal that a strong bullish trend is forming.
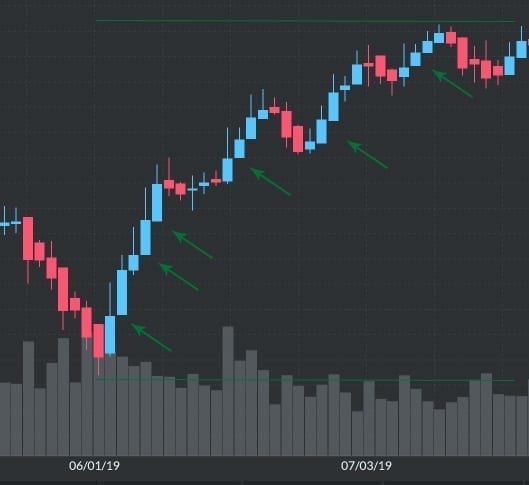
The bigger the series of no-tail candles, the stronger the expected trend will be.
As you can see in the example, the market makes a continuous and steady rise. What all positive trend-continuing moves have in common are these areas with a heavy presence of no-tail candles.
On the other hand, it is clear how the indications coming from candles with lower shadows are short-lived.
The same thing applies to bearish trends. If you spot a series of candles with no upper shadows, expect the market to embrace a new stable downward movement.
Small-Bodied Candles Indicate Trend Pauses Or Reversals
Make sure also to be cautious when candles with small bodies start popping up. Traders use them to time the moments when the trend is about to pause or reverse. Once this happens, they move to open a position as there is a high chance that the current trend might end.
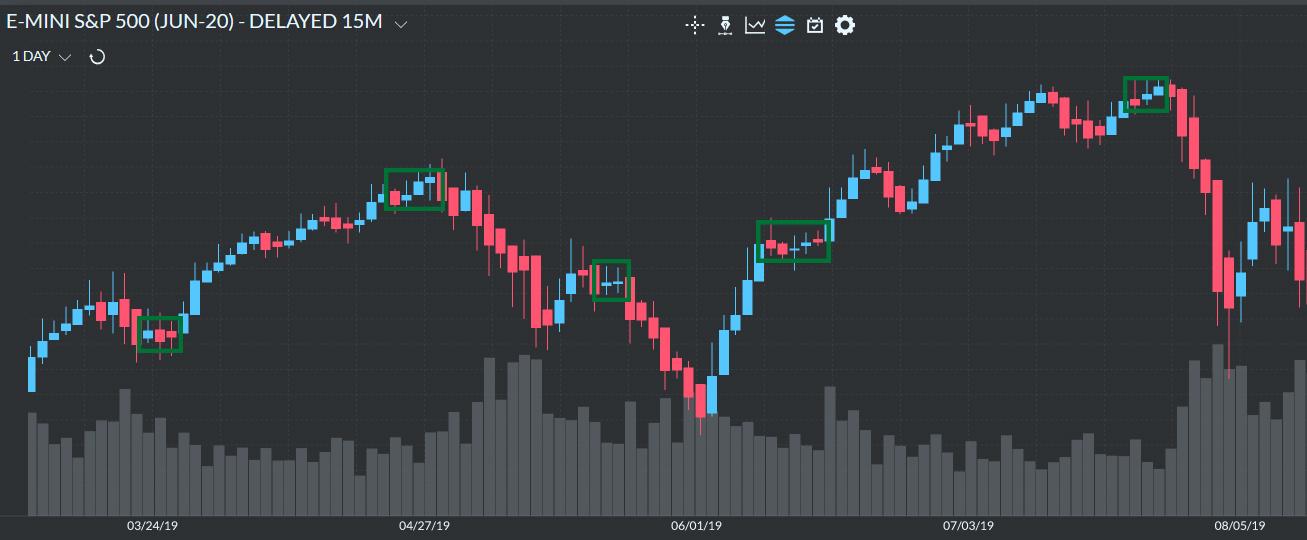
However, it is worth noting that you shouldn’t act rashly just because the next candle changes its color. This might not be another reversal but simply a pause in the trend. In the example below, you will see several areas on the S&P 500 chart where small-bodied candles start trend reversals or pauses.
Advantages and Disadvantages
Although it may sound so, the Heiken Ashi candles aren’t the Holy Grail of technical trading charts. Aside from the majority of positives, they also bear some disadvantages that are rarely talked about. Check out our list of pros and cons to find out whether this method is suitable for your trading style and preferences:
Advantages:
Filters out market noise
Nowadays, financial markets are filled with noise. This is caused by small price movements that may distort the trend and misrepresent the actual picture. Many traders find it challenging to navigate noisy markets, so they often rely on the Heiken Ashi candles. Using this type of chart can isolate the noise and picture only the real market trend. That way, they can better understand what drives the price and whether or not it is just facing short-term volatility. It’s also instrumental in helping to plan their entry and exit points.
A better indication of the trend
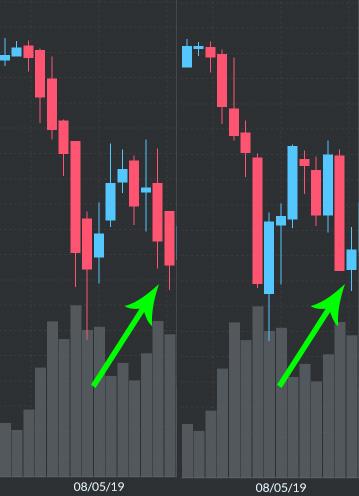
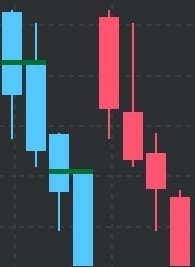
Heiken Ashi candles represent the market trend way more accurately when compared to traditional Japanese candlesticks. This is best understood when we take a look at an example.
In the first image, you can see a Heikеn Ashi chart on the left that indicates the trend is still in a strong downside movement.
On the right image, however, you see a traditional Japanese candlestick chart. It suggests that the bullish sentiment is getting stronger. If the trader takes this into account and decides to go long, he will basically buy in the middle of the downtrend and suffer losses.
So, the traditional candle closed blue. Meanwhile, the Heiken Ashi reveals that the S&P 500 is still in a downward movement.
Improves the chart’s readability and highlights signals
Traders fancy Heiken Ashi charts because they make the trend easier to read. It indicates, for example, when to ride the trend and when to head for the exits once it starts weakening. In other words, the charting technique boosts traders’ confidence by showing that a particular opportunity (entry or exit) is well-available. Compared to traditional charts, there is a lower chance that it might be a false signal.
Disadvantages:
Doesn’t reveal the full price information
Since the Heiken Ashi candles are averaged, they can’t reveal the exact open and close prices. What the trader can actually see is the HA closing price. While this might not be a problem for long-term traders, the limited pricing information doesn’t bode well with the more active ones. They prefer traditional Japanese candlesticks derived from the actual prices and visualize the open and close values on the chart.
Not suitable for active traders (day traders or scalpers)
The reason is that the Heiken Ashi candles are based on information for two periods (current and previous). This means it takes them more time to develop.
While long-term traders aren’t so time-sensitive, scalpers and day traders might find this an issue. Due to the specifics of their trading strategies and the fact that they try to exploit price opportunities as soon as they arise, they usually avoid trade setups that take longer to develop. That is the reason why they are more willing to use traditional Japanese candlestick charts.
Lack of price gaps
A large segment of technical traders uses price gaps to analyze price momentum, trigger entries, or position their stop-loss orders. The issue with Heiken Ashi candles is that they lack price gaps. However, the truth is that this limitation can be avoided successfully if, during the trading session, the trader switches between Heiken Ashi candles and traditional Japanese candles.
How to set it up in your trading platform?
After you are aware of the advantages of Heiken Ashi and how it complements traditional Japanese candlesticks, you will probably want to test it yourself. Setting it up on a platform is an easy and straightforward task, even for those taking their first steps on financial markets.
Here is a basic three-step guide for the steps to follow to complete the setup on the Finamark platform:
1. After choosing the instrument you would like to trade, click the “Show Indicator Settings” button right above the chart.

2. Next, a semi-transparent tab appears where you can see all the indicators available on the Finamark platform, as well as your collections.
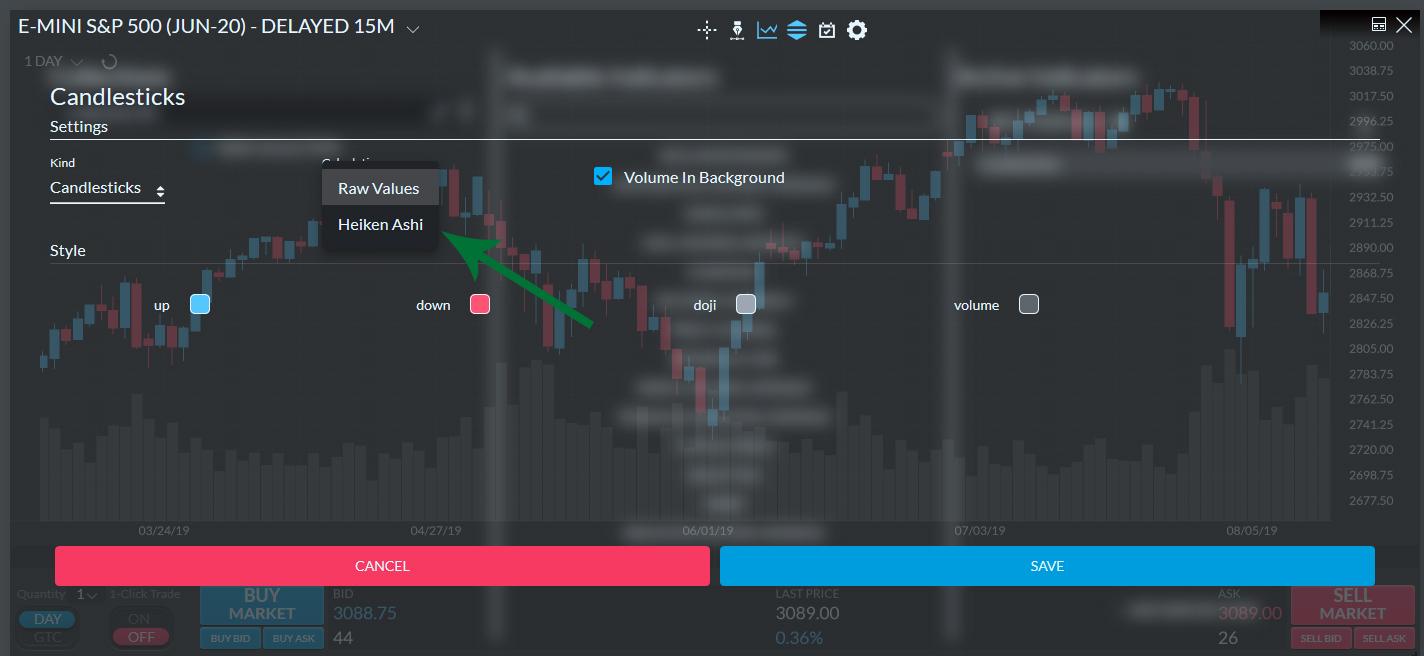
On the right side of the tab, you will see the “Candlesticks” section. Click on the “Settings” button, as shown in the image below.

3. The default option for the “Calculation” tab is set to “Raw Values”. Change it to “Heiken Ashi”.
Here, you can also modify the colors of the candles, including dojis, choose whether you want to see the trading volume and in what color, what pricing information you prefer (HLC or OHLC), and more.
Then click “Save” and close the tab from the “Hide Indicator Options” button. The Heiken Ashi chart is now on.
F.A.Q
Use the Heiken Ashi to filter noise and identify when a strong market movement is about to occur. The versatile tool can help you forecast trend reversals and pauses, as well as to better time the perfect entry and exit points. You can also use it to identify the support and resistance levels and draw trend lines.
It depends on what your trading style and strategy are. If you are a time-sensitive trader, then Japanese candlesticks are a better choice. If you are a long-term trader, then you might well use Heiken Ashi. In fact, both charts have their drawbacks and advantages. The best thing to do is to complement them and switch between each, depending on the situation.
Like any other technical trading technique, the Heiken Ashi candlesticks aren’t reliable 100% of the time. That is why it is often better to complement it with additional indicators and trade on signals generated from both or multiple sources.
The degree of reliability also depends on what the charting technique is used for. For example, the indicator is considered very reliable for timing the exits and entries and making informed decisions while in a trend.