
Technical analyses generally revolve around indicators, whether you are a day or swing trader. After all, without technical indicators, where would we get relevant information about price actions, market trends or chart patterns? These indicators can be broken down into two main categories: leading and lagging indicators. One attempts to forecast future price movements and the other provides delayed feedback and confirmation of market trends. What are these indicators? In this article we’ll explore some examples of them. We hope by the end you’ll know enough to decide which ones best fit your trading style.

What Are Leading and Lagging Indicators?
Leading and lagging indicators are technical analysis tools used for evaluating the strength and weakness of financial markets. Leading indicators change before a new market trend. Meanwhile lagging indicators provide insights about the historical data of a particular market.
Essentially, leading indicators provide traders with predictive signals on market movements. While lagging indicators provide signals after a trend that is already underway, hence the “lag” aspect. In any case, investors and traders use both classes of indicators extensively in technical analysis to help them get a better read on the market. Another use is to identify ideal entry and exit points.
You may also like:
Brief history of leading and lagging indicators
Technical analysis indicators have a long history that dates as far back as the early 20th century. The idea behind them is based on the Dow Theory, which essentially asserts that market movements are not random. Therefore, it is possible to predict their next direction by thoroughly analyzing prior market behavior.
Over the years, clever ways of reading chart patterns emerged. This gave rise to the flurry of lines, bars, and graphs that make up our trading indicator tools today.
In addition to their beneficial uses in the financial markets, leading and lagging indicators also serve as a viable measure of economic performance. As such, indicators are not strictly concerned with price actions and technical analysis, but also for measuring business goals and other economic variables and indexes.
What Are Leading Indicators?
Leading indicators utilize past price data to forecast future price action in the market. They are “leading” the price. In other words, traders can use these indicators to anticipate price movements ahead of time. This in turn potentially lets them open or close their trades at the start of the movement and ride a particular trend.
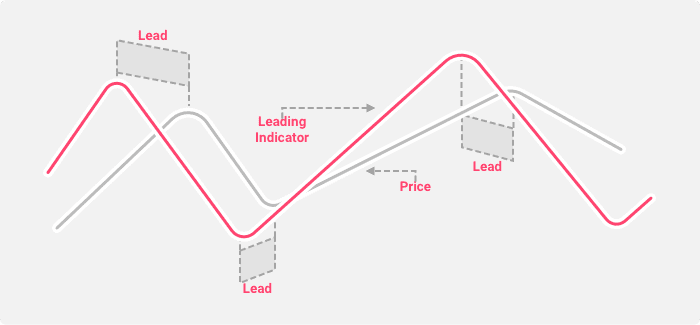
As you can see from the illustration below, the leading indicator line shows the rise and fall of the market before the price change actually occurs. As such, leading indicators typically identify whether the market is ‘overbought’ or ‘oversold’, which then helps traders establish their market entry or exit points.
The premise here is that a market that is considered to be overbought is expected to pull back eventually, indicating a need to exit a long (buy) position or sell it short since the price is about to drop. On the other hand, a market that is deemed to be oversold is expected to rebound, indicating a need to long (buy) the market and ride the anticipated rise in price.
However, leading indicators are never 100% accurate in their predictions, and are in fact, quite notorious for their false signals. The downside of anticipating a move before it actually happens is that there’s always the possibility that the market could move in the opposite direction.
Following them blindly can result in huge losses and that’s why savvy traders often combine leading indicators with other forms of technical analysis, such as the lagging indicators.
Examples of Leading Indicators
Now that you have a clearer picture of what leading indicators are, let’s take a look at some examples.
Stochastic Oscillator
The stochastic oscillator operates on the premise that changes in market momentum typically occur much faster than changes in price or volume. As such, we can use it to predict market movement direction by comparing recent closing prices to the trading range of previous sessions.
Buy and sell signals are generated on the stochastic oscillator when the movement reaches its 20 and 80 point ranges. When the oscillator reaches 80 or above, the market is deemed overbought and is therefore expected to slide down. Conversely, when it touches 20 or below, the market is considered oversold with a resulting expected price rise.
Key Support and Resistance Levels
Support and resistance levels occur when the price approaches a set level multiple times over a given period without breaking through it. This means that once the price gets to that level, it will bounce off of it and move in the opposite direction. A resistance level is like a ceiling beyond which a price has a hard time climbing. A support level is like a floor beyond which a price tends to not fall.
Knowing where the support and resistance levels are on a chart can help traders predict market trends in the near future and therefore. It also helps them identify ideal entry and exit points.
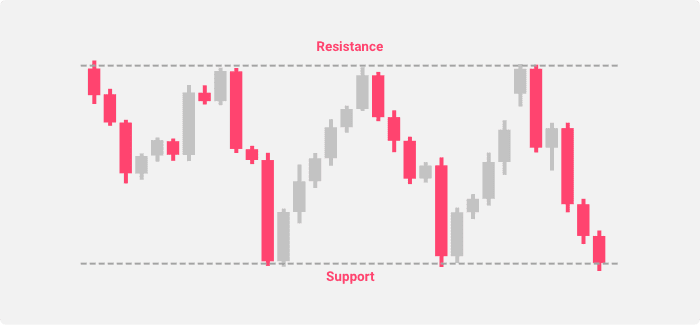
In the above illustration, you can see how the price bounced off of the resistance and support levels and then moved in the opposite direction. So if you want to place a trade, then theoretically, you could just wait for a declining price to hit the support line before going long since the price is likely to rise from there. This of course assumes that the support will not break.
Other popular leading indicators include:
- Fibonacci retracements
- Donchian channels
- Relative Strength Index (RSI)
- Williams %R
What Are Lagging Indicators?
Lagging indicators also utilize past price action data. Rather than predict future market movements, they are used mainly to confirm the current trend direction and strength. They’re essentially “lagging” the market so traders and investors can be sure that a particular trend is not just a false signal before placing a buy or sell order.
Based on the illustration, you can see that the lagging indicator occurs after the price changes. This means that anyone watching the market will witness the price action before the indicator then confirms it.
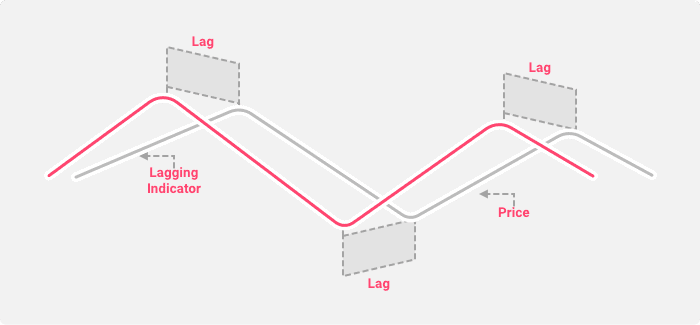
Of course, this ultimately results in the trader losing out on a few pips after the move has begun. But for many, it is a necessary cost to pay since the potential losses of trading on a false signal may be a lot more. By taking the time to generate transaction signals and confirm the strength of a current trend, you are able to make informed trade decisions.
Lagging indicators are typically drawn directly on the price chart and are great tools in trending markets or in markets that experience high volatility. Many traders favor them because they help them trade with more confidence. In fact, it is not uncommon for savvy traders to plot two or more lagging indicators to validate price trends before executing a trade.
That being said, it is important to not be too reliant on lagging indicators. They can lull you into a false sense of security if you believe they can make a profit all the time. Since they are slow to react, there’s always the risk of losing out on good gains or even turning a complete loss. This is especially the case in situations where price changes tend to occur really fast in volatile markets such as cryptocurrencies.
The ideal trading strategy will therefore involve a mix of both leading and lagging indicators. Using one set to predict market movement and the other set to confirm it.
Examples of Lagging Indicators
There are several lagging indicator tools available today. It’s important to note that they use different calculations. As a result there is the possibility that each one will show different signals. Let’s take a look at some examples:
Moving Averages
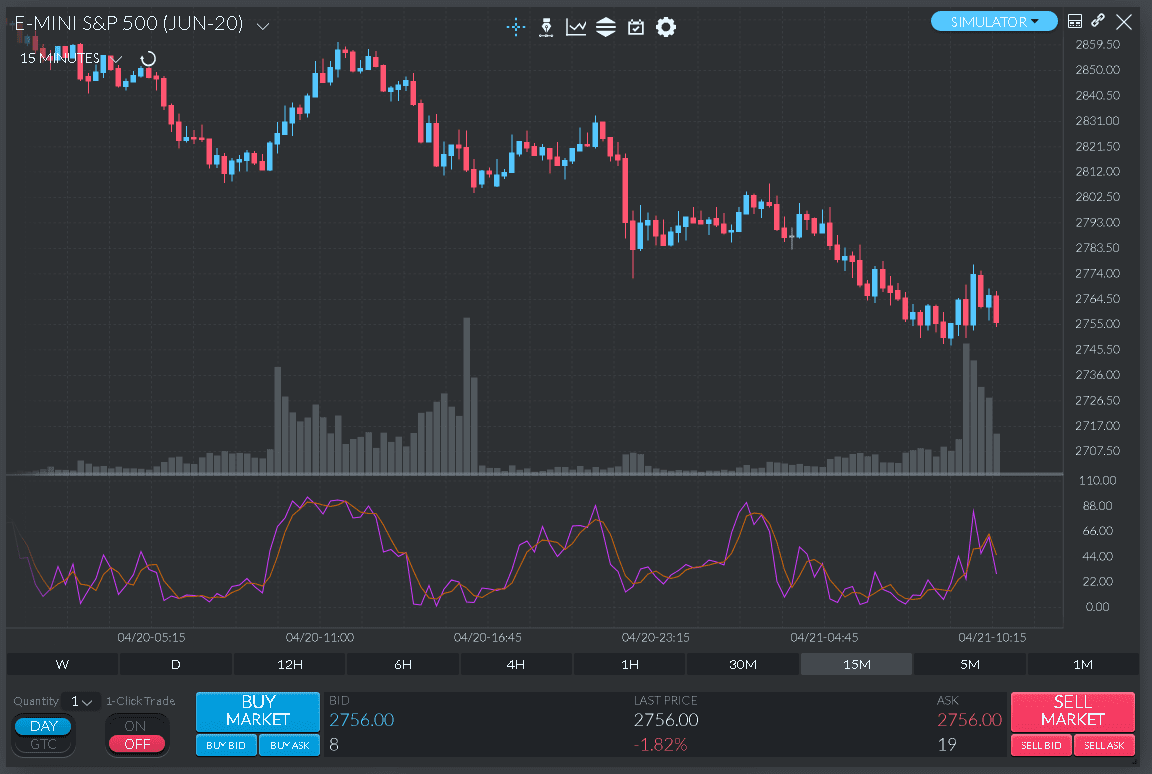
The moving average (MA) is a lagging indicator because it generates buy or sell signals based on historical price data. A buy or sell signal occurs when the price line crosses the Moving Average line or when two MA lines cross each other. However, since we calculate it based on previous price points, the current price will always be ahead of the MA.
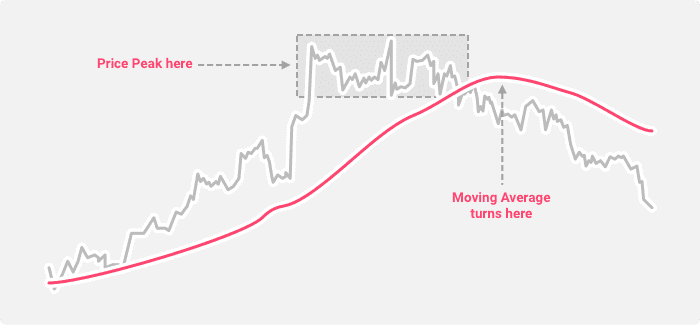
As you can see in the chart above, it’s only after the price has peaked that the MA crossed above it. Still, it does confirm that the market is currently in a downtrend for the short-term. For a trader that’s useful information.
Bollinger Bands
Bollinger bands fall under the category of volatility indicators. It comprises of a simple moving average (SMA) line and two outer lines which represent the standard deviations away from the SMA and therefore serve as a suitable measure of volatility.
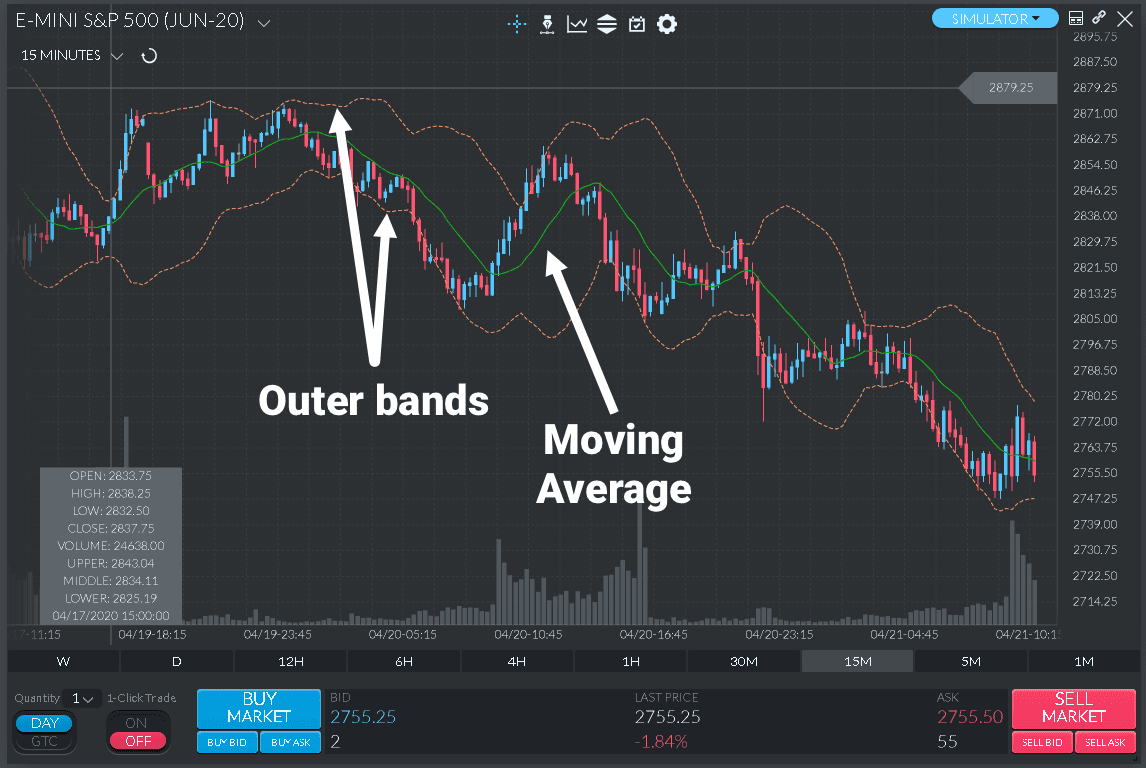
The outer bands will widen in relation to increasing volatility and contact as volatility decreases. This is beneficial to traders since it helps them “time” their trades. After all, no one wants to be holding a position when the market is going through extreme volatility.
Other popular lagging indicators include:
- Moving Average Convergence Divergence (MACD)
- Supertrend
- Parabolic Stop and Reverse (Parabolic SAR)
Final Thoughts
Whether you use them for technical analysis, business planning, or macroeconomics, leading and lagging indicators are crucial to making informed decisions. Now that you have an idea on how to utilize them, it’s up to you to decide which indicator tools to integrate into your trading system based on your risk tolerance and investing goals.
Note that some tools will work better in certain environments than in others. Feel free to play around with them on a virtual account and perfect your interpreting skills before unleashing them on live charts.