
Macroeconomic indicators give traders and investors crucial insights into the state of a country’s economy. Discover the most important economic indicators that can impact profitability in various financial markets, including indices, forex, and derivatives.
In this article, we’re going to cover the following:

Introduction
The condition of the economy essentially dictates the ebb and flow of financial markets. If the economy is declining or about to decline, financial markets are likely to follow suit.
For example, during the height of the COVID pandemic in 2020 – 2021, global economic activity came to nearly a halt. As a result, financial markets all over the world experienced some of the worst crashes this century has seen — oil prices traded below $0, crypto markets were shredded, and even the almighty S&P 500 dropped over 12%.
That’s why successfully navigating financial markets requires you to have at least a basic understanding of macroeconomic indicators and how they may influence price action. These indicators can help you better understand where the economy is headed, which in turn, can influence market performance across the board.

What Are Macroeconomic Indicators?
Simply put, macroeconomic indicators are data readings or statistics that reflect a country’s economic conditions. These indicators are used by the government, investors, and analysts to assess economy-wide phenomena to make informed decisions.
Macroeconomic indicators track only aggregates — issues, objectives, and policies that affect the economy on a national level. Nearly everything has an economic data point, whether it’s consumer spending, oil inventories, shipping, transportation, and so on.
Macroeconomics vs. Microeconomics
To better understand the concept of a macroeconomic indicator, it’s important to have an idea of how macroeconomics and microeconomics differ.
Microeconomics focuses on the decision-making behavior of individuals, households, and companies regarding how they allocate their resources. It also looks at how these decisions impact the general market, including demand, supply, and price.
On the other hand, macroeconomics takes a holistic view of the structure, performance, and decision-making processes of the economy as a whole. This means studying entire industries and economies as opposed to individuals or singular businesses. Macroeconomic analyses are conducted to interpret the state of the economy and ensure that policies are made based on existing, reliable data.
Purpose Of Economic Indicators
Studying economic indicators helps provide valuable insight into how the economy is performing now and, based on that, how it is likely to perform in the short and long terms. Macroeconomic data releases are published periodically, usually by the government. These often have predictable schedules so stakeholders know exactly when the numbers are coming out and can position themselves accordingly.
Traders and investors typically follow announcements for macroeconomic indicators because each release can dramatically impact the financial markets. They can use this information that can help them adjust their portfolios and open positions accordingly, as well as discover new opportunities.
That’s why several aspects of fundamental analyses are typically conducted using a top-down approach that includes economic indicators.
Because most economic indicators are researched and interpreted by and/or for policymakers, they can also influence decisions that impact political strategies.
Lastly, economic indicators largely affect the financial markets in that particular country. For example, data released in the United States will have a more direct impact on the U.S. dollar, the Dow Jones Industrial Average, and U.S. companies than on other markets in other countries.
The Most Important Macroeconomic Indicators
Without an economics expert, it can be challenging to make sense of macroeconomic data releases. What numbers should you look for? What do they mean? And why are they important from a trader or investor’s perspective?
To help simplify things, here are some of the main macroeconomic indicators that do matter and how they impact price action across the markets.
Consumer Price Index (CPI) and Inflation
The CPI measures changes in the cost of products and services over a given period, usually monthly. Most countries have their own consumer price index, so it’s important to keep an eye on the CPI for any country in whose financial markets you hold a vested interest.
The Bureau of Labor Statistics (BLS) calculates the CPI in the United States as a weighted average of price changes and how they impact aggregate consumer spending in that month. Changes in the costs of shelter, food, and medical care are among the largest contributors to the index.
| Seasonally adjusted changes from preceding month | Un-adjusted 12-mos. | |||||||
| Mar. 2022 | Apr. 2022 | May 2022 | Jun. 2022 | Jul. 2022 | Aug. 2022 | Sep. 2022 | Ended Sep. 2022 | |
| All Items | 1.2 | 0.3 | 1 | 1.3 | 0 | 0.1 | 0.4 | 8.2 |
| Food | 1 | 0.9 | 1.2 | 1 | 1.1 | 0.8 | 0.8 | 11.2 |
| Food at home | 1.5 | 1 | 1.4 | 1 | 1.3 | 0.7 | 0.7 | 13 |
| Food away from home | 0.3 | 0.6 | 0.7 | 0.9 | 0.7 | 0.9 | 0.9 | 8.5 |
| Energy | 11 | -2.7 | 3.9 | 7.5 | -4.6 | -5 | -2.1 | 19.8 |
| Energy commodities | 18.1 | -5.4 | 4.5 | 10.4 | -7.6 | -10.1 | -4.7 | 19.7 |
| Gasoline (all types) | 18.3 | -6.1 | 4.1 | 11.2 | -7.7 | -10.6 | -4.9 | 18.2 |
| Fuel oil | 22.3 | 2.7 | 16.9 | -1.2 | -11 | -5.9 | -2.7 | 58.1 |
| Energy services | 1.8 | 1.3 | 3 | 3.5 | 0.1 | 2.1 | 1.1 | 19.8 |
| Electricity | 2.2 | 0.7 | 1.3 | 1.7 | 1.6 | 1.5 | 0.4 | 15.5 |
| Utility (piped) gas service | 0.6 | 3.1 | 8 | 8.2 | -3.6 | 3.5 | 2.9 | 33.1 |
| All items less food and energy | 0.3 | 0.6 | 0.6 | 0.7 | 0.3 | 0.6 | 0.6 | 6.6 |
| Commodities less food and energy commodities | -0.4 | 0.2 | 0.7 | 0.8 | 0.2 | 0.5 | 0 | 6.6 |
| New vehicles | 0.2 | 1.1 | 1 | 0.7 | 0.6 | 0.8 | 0.7 | 9.4 |
| Used cars and trucks | -3.8 | -0.4 | 1.8 | 1.6 | -0.4 | -0.1 | -1.1 | 7.2 |
| Apparel | 0.6 | -0.8 | 0.7 | 0.8 | -0.1 | 0.2 | -0.3 | 5.5 |
| Medical care commodities | 0.2 | 0.1 | 0.3 | 0.4 | 0.6 | 0.2 | -0.1 | 3.7 |
| Services less energy services | 0.6 | 0.7 | 0.6 | 0.7 | 0.4 | 0.6 | 0.8 | 6.7 |
| Shelter | 0.5 | 0.5 | 0.6 | 0.6 | 0.5 | 0.7 | 0.7 | 6.6 |
| Transportation services | 2 | 3.1 | 1.3 | 2.1 | -0.5 | 0.5 | 1.9 | 14.6 |
| Medical care services | 0.6 | 0.5 | 0.4 | 0.7 | 0.4 | 0.8 | 1 | 6.5 |
Generally, there are two types of consumer price indexes published by the BLS each month — the Consumer Price Index for All Urban Consumers (CPI-U) and the Consumer Price Index for Urban Wage Earners and Clerical Workers (CPI-W).
The CPI-U represents 93% of the population living and spending money in urban areas. It is also the basis for CPI data that matters to financial markets. On the flip side, the CPI-W covers 29% of the population whose income is derived primarily from clerical employment or professions with hourly wages. It is used in adjusting Social Security payments, pensions, and other federal benefits to account for changes in the cost of living.
What makes the CPI a good economic indicator?
CPI is widely recognized as a prominent indicator for both inflation and deflation since it essentially measures the cost of living over a given period.
Policymakers, businesses, and market participants must pay close attention to CPI numbers for signs of inflation or deflation. For example, rising inflation typically leads to higher interest rates and reduced borrowing, whereas deflation can lead to lower interest rates and increased lending. Both situations can significantly impact economic activities at both the micro and macro levels.
That being said, keep in mind that the CPI is a lagging indicator, meaning the data is only available after the event being measured has occurred. As such, it might not be 100% accurate for current levels of inflation. That’s why it’s important to use the CPI in conjunction with other indicators.
Gross Domestic Product (GDP) Figures
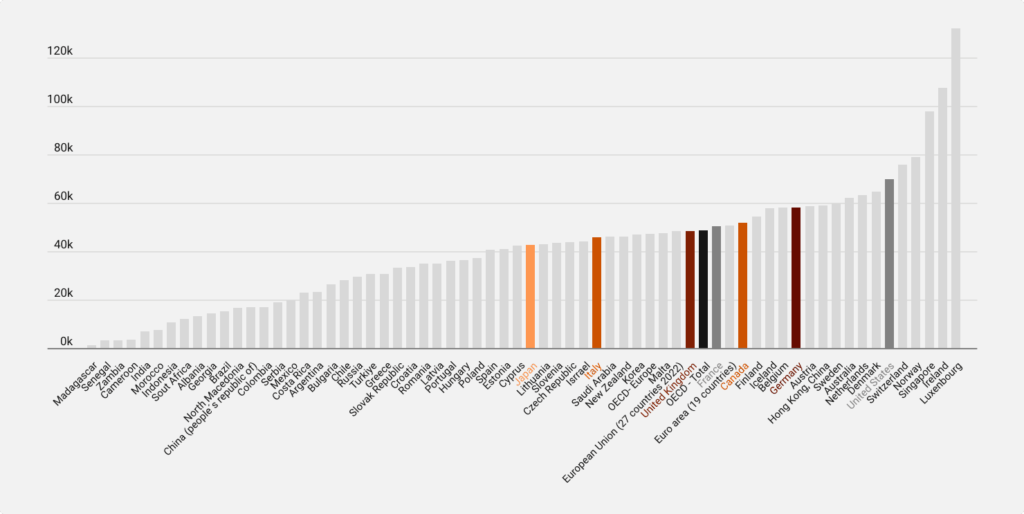
The GDP is the standard measure of the total monetary or market value of all finished goods and services produced in a country over a given period. It also measures how much income was earned from that production and how much was spent to acquire the finished goods and services over that period.
In this way, GDP provides a broad measure of overall domestic production, which in turn, provides useful insight into the country’s economic health. There are four main components when calculating a country’s GDP — Consumption, Government Expenditure, Investment, and Net Exports.
GDP is typically calculated on an annual basis, though there may be instances where it is calculated on a quarterly basis.
GDP per capita takes the total GDP of a country and divides it by the number of people.
Calculating the GDP means taking into account the aggregated private and public consumption, government spending, investments, paid-in construction costs, and the foreign balance of trade.
However, the foreign balance of trade is a hugely important component. That’s because it is a measure of the total value of goods and services produced in the country that are sold (exported) to other countries. This is a crucial consideration because GDP tends to rise when foreign exports exceed imports (positive net exports) and vice versa.
What makes the GDP an excellent economic indicator?
The Gross Domestic Product value provides a snapshot view of economic performance. For instance, if a country’s GDP is steadily declining, then it means the economy is also in a state of decline. This, in turn, can impact its financial markets, especially the country’s forex and derivatives sectors.
As an absolute value, it shows the overall size of an economy, as well as whether that economy is operating in a surplus or deficit over a specific period. Additionally, GDP can be adjusted for inflation (Real GDP). This makes it a reliable tool used by policymakers, investors, and businesses to guide their strategic decision-making.
Interest Rates and Fed Releases
Interest rates are the percentage returns that you pay to the lender in addition to your loan repayments. They also refer to the percentage returns that you earn for keeping your money in a savings account or fixed-income investments.
These rates are set by the central bank or related authorities in that country. In the U.S., interest rates are set by the Federal Reserve and are then trickled down to financial organizations and then consumers.
As you may expect, interest rates significantly influence consumer decisions. Higher rates mean it’s more expensive to borrow, so consumers look to cut their spending instead to meet their cash needs. Conversely, lower interest rates mean it’s cheaper to borrow, so consumers feel more confident to spend more, knowing that they can borrow more money at favorable rates should they need it.
Interest rates are also a useful tool in curbing inflation and deflation. With U.S. inflation rates setting new highs throughout the first half of 2022, the Federal Open Market Committee (FOMC) has responded by raising interest rates to discourage borrowing and curtail consumer spending. If people are spending less, then demand should drop and effectively lower the price of everyday goods and services.
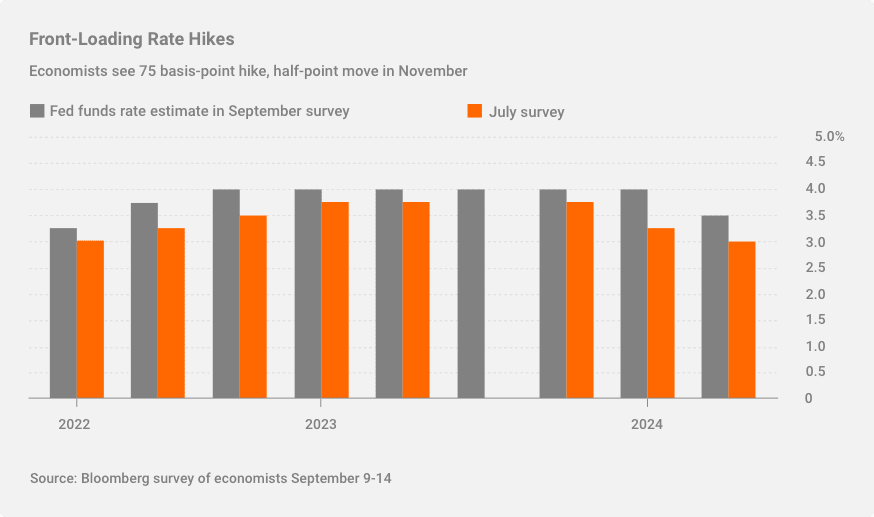
Speaking of the Federal Reserve, did you know that their interest rate announcements and meeting minutes can move markets?
While these Fed releases are not in themselves a macroeconomic indicator, they are critical for decision-making. Investors, traders, companies, and other financial market stakeholders closely monitor the announcements of changes (or lack thereof) to the FOMC’s target range for the federal funds rate. This provides insight into how interest rates may go (whether up or down) in the near future.
What makes interest rates a good economic indicator?
Interest rates directly influence how people spend, save, and invest money. This makes them an important macroeconomic indicator because consumer behavior and sentiment hugely impact the state of the economy.
As a trader, interest rates are among the most prominent factors in forex markets since they can impact currency values. Higher interest rates may indicate a strong economy and the ability to earn more interest in the country’s fixed-income or similar interest rate-driven investments. Therefore, the demand for that country’s currency rises as well. This makes it more valuable in the forex market. The reverse is also true, whereby lower rates might indicate a weak economy and less interest-earning potential. This leads to decreased demand and, ultimately, a lower market value of the currency.
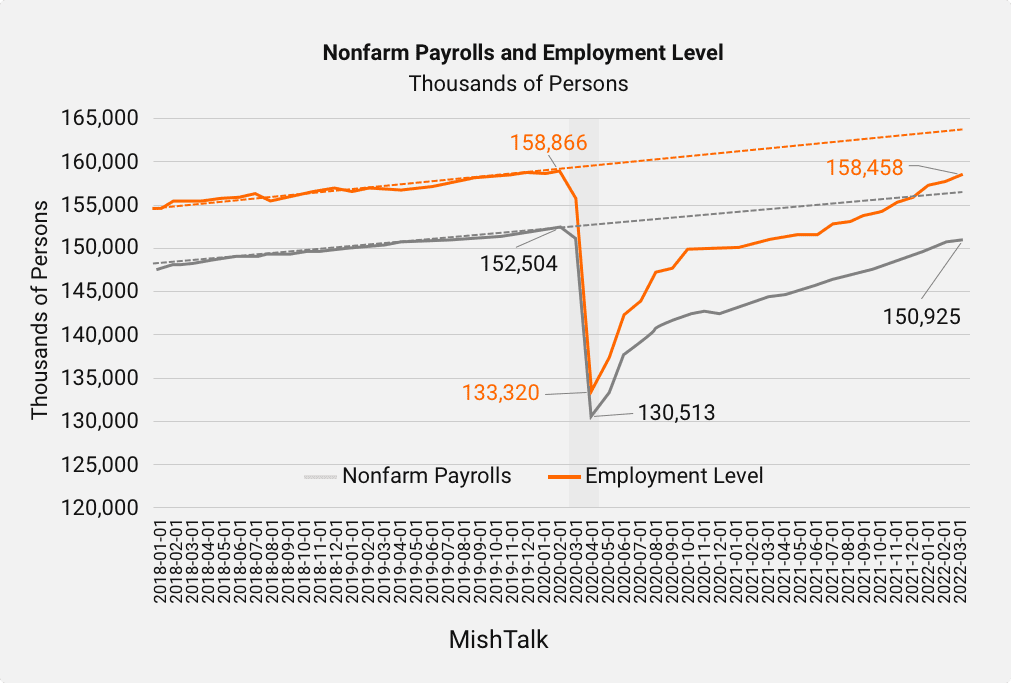
Nonfarm Payrolls (NFP) Report and Unemployment Claims
The nonfarm payroll report is one of the most important macroeconomic indicators for the United States. It represents the total number of paid workers in the country. The indicator excludes individuals working on farms, for the federal government, in private households, or in nonprofit organizations. The more paid workers there are, the better the economy is doing, all else being equal.
On the other hand, unemployment claims are determined by conducting monthly surveys on thousands of households across the U.S. Essentially, it estimates how many Americans were unemployed and actively seeking employment during the period when the survey was conducted. The lower the employment rate, the better the economy is doing, all else being equal.
What makes NFP reports and unemployment claims good economic indicators?
Nonfarm payrolls and the unemployment rate provide useful data about the overall economy. When more companies are hiring (higher NFPs and lower unemployment claims), it can be seen as a signal that businesses are doing well and, by extension, the economy performing well too.
These reports are also useful as a market indicator because strong business performance is often linked to the value of the company’s stock.
If companies can afford to hire and pay more people, then it means they’re expanding operations and exploring new growth opportunities. Similarly, if the unemployment rate is high, then it can mean that companies are cash-strapped, which may impact market sentiment negatively about their stocks.
Trading Using Macroeconomic Indicators
Trading macroeconomic data releases can be an effective strategy, particularly among day traders. By tracking the metrics that drive the economy and knowing how they may impact market performance, you can open or exit positions under more favorable circumstances.
There are two main methods to consider in this regard:
Taking a Directional View
This involves closely monitoring macroeconomic data events and trying to predict the outcome of the data release. It’s also important to have an idea of how the market will react to the release. Of course, this is a lot easier said than done since everyone knows there’s simply no predicting the market. Even more so now that global economies are still battling the effects of the COVID pandemic alongside soaring inflation rates.
In addition to needing to be right twice, taking a directional view runs the risk of harming your portfolio twice if your predictions are wrong.
One way to approach this in a less risky manner is to be a contrarian. Basically, when the market is expecting something to happen based on the macroeconomic data releases, you expect the opposite to happen. If you’re right, the market will attempt to reposition itself, and you will benefit from the resulting major price movements.
And if you’re wrong, well, at least you expected it and hopefully didn’t commit too much of your trading capital into the position, and as such, there won’t be a massive loss.
Taking a Volatility View
This approach involves capitalizing on “flow effects.” It is a common strategy in options trading, especially when traders are forced to buy or sell options to hedge their positions. Such actions can distort the price and impact implied volatility — the market’s forecast of a likely change in the price of the underlying asset. Supply and demand, which can be tracked by the CPI and interest rates, are the major considerations when calculating implied volatility.
When the market is volatile, it means it’s active and presents more opportunities for day traders.
A simple way to employ this approach is to look at how the market reacted in the last couple of times when the macroeconomic data event occurred. How much implied volatility was generated in the lead-up to the data release? This can give you a general idea of what to expect over the next occurrences. Of course, remember to use a mix of tools to confirm trends before making your move in the market.
Final Thoughts
When the price of an individual stock goes up or down, it might be the result of an announcement by the company or recent developments within that particular industry. But when major indices, such as the S&P 500 or Nasdaq, are going up or down, it’s usually due to macroeconomic factors. That’s why every trader should at least know the most important macroeconomic indicators so they stay in the loop of broader trends in the domestic or global economy that may impact their portfolios. Consumer Price Index, Inflation, GDP, interest rates, Fed releases, and unemployment rates are among the market indicators that matter most to traders. These data points provide a fairly comprehensive overview of how the economy is currently performing, which can help them make better trading decisions.