
Market volatility, alongside liquidity, is among the essential characteristics of the financial markets. Investors often use it to indicate the health and the risk/return potential of a particular instrument or a whole asset class. To do that, they focus on different market volatility indicators like Beta and VIX. This guide explores the topic of market volatility and defines why it is crucial for investors and traders. You will learn how to trade in a volatile market and reduce the risk from it.

What is Market Volatility?
Volatility measures the dispersion around the mean return of a security. We can describe it as the continuous up or down movement of a particular asset’s price.
Volatility indicates how the asset has performed compared to its historical average or a benchmark. The latter is usually a leading market index. Volatility can relate either to a single investment or asset or to an entire market.
Market volatility doesn’t measure direction but the scale of the price swings.
There are two main types of market volatility – historical and implied. Historical volatility measures how volatile the particular asset was in the past. Implied volatility indicates how unstable we expect to be in the future.
Market volatility can depend on several factors, including the asset’s specifics, the current market environment, the market participants’ behavior, and more.
Usually, leading market indices like the S&P 500 or Dow Jones Industrial Average aren’t volatile. It’s typically the same with blue-chip stocks. However, when those types of instruments start to experience higher volatility, it means something isn’t right. Such price behavior triggers can be a looming crisis, a momentum flash crash, breaking news, and asset-specific events, etc.
The general perception is that high volatility is a bad thing. However, this isn’t always the case and depends on the perspective. A higher volatility means a riskier market and more frequent and significant price changes for a short period. Some traders choose to specialize in trading when the volatility picks up. That’s because the momentum it creates can provide more profit opportunities.
However, beginner traders often find volatile markets challenging to navigate. The reason is that the more unstable the price of the traded instrument is, the higher the risk to lose money and the more cautious the trader should be.

Why is it Important?
Market volatility is significant because it gives you a general sense of the market’s stability for the asset in question. Understanding the concept can help you better interpret current stock market conditions. The basic conclusion you’re trying to draw is whether it is more or less risky to trade. You can also construct a portfolio that is a better fit for your growth objectives and risk tolerance.
Volatility is also essential because it indicates the current, historical, and future state of the market. It tells you whether or not it’s ripe for an investment at the moment. You can also learn a lot from how an asset’s volatility changes over the years. For example, after introducing a new instrument or asset class, its price usually is more volatile. As the market starts to mature, the fluctuations generally get lower and less frequent. Of course, this isn’t always the case, as some assets are more volatile by default.
We typically associate volatility with fear. This is because it tends to grow during downside markets when investors become more scared of losing their capital.
Although very related, volatility and risk aren’t the same things. For example, for long-term investments, risk matters a lot, while volatility is just noise.
Although volatility is a vital factor to consider when evaluating your investments and positions, it shouldn’t be the sole basis for your decision. Think of it as a measure of short-term uncertainty or future expectations rather than a specific and reliable forecast.
How to Calculate Market Volatility?
Volatility is calculated as standard deviation (variance2) and signals how tightly the price is grouped around the mean or moving average (MA).
Let’s showcase that with numbers. For the sake of simplicity, assume that the stock XYZ’s closing prices are gradually increasing. They start from $1 and go up to $10. In that case, we can calculate variance with the following process:
1. Finding the mean
Make sure to work with a spreadsheet. I’ll make your job much easier since all calculations can be automated.
We should add all the prices together and then divide them by 10 (the number of periods).
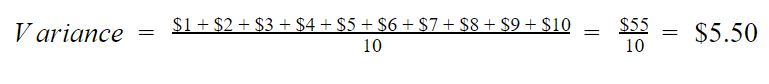
The result indicates the average price for the observed period.
2. Calculate the difference between each closing price and the mean
For example, for day one, you have $1 – $5.5 = -$4.5. You should perform this calculation for all periods. Square the deviations to eliminate the negative values.
3. Add the squared deviations and then divide them by the number of periods
In our case, when we add all the squared deviations together, we get a result of 82.5. As a next step, we have to divide it by the number of data values (in our case, 10).
The result for the variance is $8.25. The standard deviation equals its square root, which is $2.87.
What this tells us is how far the price can deviate from the average one. Alternatively – it quantifies volatility to better prepare the trader for the potential expected losses or gains.
The difference between calculating historical and implied volatility lies in the data. For the former, we have to use a series of past market prices. Meanwhile, for the latter, we use the market price of a market-traded derivative (i.e., an option). For a more straightforward calculation of implied volatility, investors use the Chicago Board Options Exchange’s Volatility Index, VIX. You can also learn more about it in our article.
How to Trade in a Volatile Market?
Nothing can make traders doubt their strategies more than market volatility. Once the price goes out of bounds, market participants might begin to question their approach and reconsider whether they should retain their open positions.
Always bear in mind that the biggest enemy of your portfolio is not volatility itself but your emotions. If you can’t bear your portfolio taking a 30% or 50% hit during a volatile bear market, then you will indeed consider closing your positions. However, don’t forget that volatility is a short-term price instability, and, at some point, the prices of the assets in your portfolio will normalize. The best thing you can do is not get carried away with this disastrous mental image. It’s just temporary and will pass on.
Yet, in many cases, heading for the exit is the preferred scenario, especially if you are a beginner. If you haven’t tested your strategy in volatile market conditions, it is advisable to remain on the sidelines until things calm down and the environment gets safer. It’s also worth noting that volatility presents a much greater risk if you’re trading on an account with a drawdown limit, which usually makes exiting your positions during volatile markets much more tempting.
I’ve always said, the key organ here isn’t the brain, it’s the stomach. When things start to decline – there are bad headlines in the papers and on television – will you have the stomach for the market volatility and the broad-based pessimism that tends to come with it?”
-Peter Lynch
10 Tips on How to Navigate Volatile Markets
Here are a few pieces of advice on how to trade in volatile markets to increase your chances of success:
- Backtest your strategy in volatile market conditions before you go live;
- Stick to your strategy if you did your research and already proved that it can work in volatile markets;
- Keep a trading journal to see how you have navigated previous volatile periods;
- Reduce your position size and target smaller profit goals;
- Don’t stick to fundamentals. They aren’t always reliable during erratic and volatile markets;
- Focus more on charts and short-term technical indicators;
- Analyze your setups on multiple time frames – if their signals are present everywhere, there is a higher chance for them to work;
- If you aren’t in it for the long-term, make sure to take your profits as soon as they appear, before the volatility wipes them out;
- Be careful with leverage since, during volatile markets, it can be suicidal for your portfolio;
- Stick with what you know and don’t focus on the opportunities that might slip through your fingers.
Think of market volatility as a storm on the open seas. In such extreme situations, the captain’s main goal is to steady the ship to prevent it from sinking. Continuing on its course is the least of his concerns. That is why the most critical thing during volatile markets is to first ensure your safety before aiming for profits.
Does Market Volatility Affect Your Trading?
Periods of volatility significantly and inevitably affect your trading. During severe market instabilities, you will hardly be able to conduct regular trading activity due to market participants’ changing behaviors and financial service providers.
Your broker, for example, might prioritize decreasing its exposure to market risk. This means it might halt normal automatic order execution and instead switch to manual order handling. This will result in delays. This effect could be exacerbated by the fact that, during volatile times, markets might be flooded with higher trading volume.
To avoid such situations, make sure to get familiar with the way your broker handles high-volatility market periods beforehand. If it switches to manual order execution, you might prefer to close your positions and remain on the sidelines until the market calms down.
Although rare, you should be prepared for cases where trading is halted altogether, and it gets impossible to execute your trades. During market crashes and periods with extreme volatility, market-making systems might not handle the digital mayhem. However, most brokers offer mobile phone trade execution so that you can have a backup plan.
The most essential way market volatility can affect your trading is by flooding you with incorrect price quotes. Alternatively – the price between the quote and the one at which the trade is executed might be significantly different. The reason is that high market volatility can distort even real-time quotes. Also, the number of shares available at the quoted price might change quickly due to increased market interest.
There are various other ways volatility can affect your trading, but the common thing between them is the increased risks for your portfolio.
How to Reduce Risk from Market Volatility?
Market volatility is inevitable, so the question is not how to avoid it but how to reduce its impact on your portfolio.
The most efficient approach to overcoming market volatility is retaining a long-term investment approach. In the end, volatility is short-term uncertainty, so if your horizon extends beyond the next several months or a couple of years, then the effect of price instabilities on your portfolio will be significantly mitigated. Unfortunately, this isn’t an option for day traders.
To reduce the trading risks in volatile markets, it is advisable to avoid using market orders that require immediate execution. However, when the market moves fast, you might get a different price than what you aim to execute the deal at. Instead, make sure to use limit orders. That way, you can lock-in a price beforehand and avoid any unpleasant surprises due to the rapidly-changing market dynamics.
Bear in mind that while fundamentals aren’t a useful tool during high-volatility periods, they are a perfect hedge if taken into account beforehand. Alternatively, if you have identified companies with strong fundamentals and long-term growth potential, then volatility won’t affect your investments in the short-term. That way, you can ensure an efficient risk mitigation strategy and your peace of mind during stressful market periods.
Market Volatility Indicators
There are two basic types of market volatility indicators, based on what they measure and their scope.
The first type measures historical volatility and is applied independently to each specific asset. It gives you an idea of how much an asset’s price has varied from its average historical price. An example of such an indicator is Beta.
The other type measures implied volatility or the expected price deviations for the particular instrument in the future. It is indicative of the general market volatility. The volatility index VIX by the Chicago Board Options Exchange is one such indicator.
Beta
Beta measures the instrument’s historical volatility in the context of the S&P 500 index. The indicator is used mostly to quantify the past price fluctuations of individual stocks.
If Beta > 1, then the stock’s past performance is considered more volatile than the S&P 500. Alternatively, a Beta < 1 indicates that the company is less volatile than the benchmark.
For example, assume that the Beta for company ABC is 1.5. In that case, for every 1% rise or drop in the S&P 500 value, the share’s price would change by 1.5%.
Although quite rare, in some cases, the Beta might turn out negative. Such scenarios signal that the instrument moves in the direction opposite of the market.
VIX
The CBOE Volatility Index (VIX) reflects the expected volatility of the whole market over the next 30 days. It is referred to as the “fear gauge,” meaning that it signals how confident or cautious investors are about the upcoming market developments.
The VIX uses the prices of a basket of put and calls options on the S&P 500 to measure the implied volatility. Historical evidence has shown that when the VIX rises, the S&P 500 typically drops, and vice-versa.
The absolute value of the index isn’t as crucial as its general trend. If the VIX goes up, it means investors are more worried about future price movements. This suggests higher expected volatility. On the other hand, if it goes down, market participants’ views are more relaxed. From that, we can assume lower expected volatility.
Examples of Market Volatility
S&P 500’s historical volatility (annualized standard deviation) for 1926 – 2017 is estimated at 15.2%. In the midst of the Global Financial Crisis in 2008, the standard deviation was 20.1%, with 21.3% the following year. The most volatile year in the index’s history was 1932, when the standard deviation hit 65.4%. Yet this isn’t indicative of the performance of stocks. Despite the high volatility in 1932, the stocks for the same year moved with just 8.9%.
On a day-to-day basis, big indices don’t move more than 1%. However, market volatility can pick up when external events create uncertainty. In cases where the S&P 500 and DJIA gain or lose more than 4% – 5% of their value, we can talk about rare and unexpected situations. During the 2010 Flash Crash, for example, leading indices like the DJIA lost up to 9% of their value for the span of a couple of minutes, which were regained afterward.
The common thread between all extreme market volatility events is that the market recovers sooner rather than later and then often embraces a new bullish attitude.
Volatility depends on many factors, including the industry, the type of asset, the investors’ interest, and more. For example, with stocks, some sectors tend to be more volatile than the rest. These include biotech, technology, and commodities, to name a few.
On an asset-specific level, there are also dependencies. The volatility of GOOGL, for example, will be much lower than that of a penny stocks company. What is more important is to learn how to find the optimal ratio between low volatility and steady returns.
The Connection between Market Volatility and Liquidity
Liquidity shows how lively a market is. Alternatively – how much interest there is in the particular asset. Liquidity is determined by the number of traders and the total volume they generate. An example of a highly-liquid market is Forex, open 24/7, or blue-chip stocks like MSFT or AAPL. Trading jargon also refers to liquidity as “market depth.” The higher the liquidity, the deeper the market.
To get to the main question – the connection between volatility and liquidity is rooted in price stability. Usually, more liquid markets are considered more stable and less volatile. The reason is that if the trading volume is low, even small-magnitude orders can destabilize the price. On the other hand, instruments that generate millions of dollars of trading volume per day are less likely to be affected even by bigger investors’ orders.
Never think that lack of variability is stability. Don’t confuse lack of volatility with stability, ever. Fragility is the quality of things that are vulnerable to volatility.”
– Nassim Nicholas Taleb
In mature markets like stocks, futures, and forex, there is an almost universal rule – liquidity and volatility have an inverse relationship. Low liquidity usually means the volatility will be high, and vice-versa. Due to this, investors have to look only at either one of these characteristics to conclude both. At least in the context of analyzing the market’s current state
However, this isn’t always the case. In many situations, assets with high liquidity can also be extremely volatile. That is why it is essential to focus on the asset’s fundamentals and the key factors that might affect its liquidity and volatility going forward. For stocks, these are quarterly earnings reports and relevant news. Meanwhile, for futures, you should consider seasonality, the geopolitical situation, and more.
Final Thoughts
The concept of volatility is straightforward yet critical to the way investors navigate financial markets. It is so essential that today, there are whole hedge funds specialized in the development of volatility-driven trading models.
Markets love volatility.“
– Christine Lagarde
Whether you are an experienced trader or a beginner who is in for the long-term, you should be aware of the concept of volatility and interpret it on both – micro and macro levels. That way, you will be better protected against unexpected market disruptions and their implications on the contents of your portfolio.