
Moving averages are among the first indicators that technical trading education usually starts from. They are highly popular and widely used. However, despite that, MAs are far from the most accurate technical trading tools. The following guide dives into a less-known but much more reliable tool, the McGinley Dynamic Indicator. It will teach you how to calculate McGinley Dynamic as well as its application and main characteristics. Our goal is to reveal how it can help you improve your trading efficiency. Finally, we will compare it to other technical trading tools and learn why it is considered underrated.

What is the McGinley Dynamic Indicator?
The McGinley Dynamic Indicator is an advanced type of moving average that adjusts for shifts in market speed. Think of it as an MA with a filter, smoothing price data to avoid whipsaws.
This technical analysis tool was designed to solve the main issue with moving averages, their reliance on fixed time periods. It helps solve the issue of varying market speeds and provides a more accurate reflection of price action.
The McGinley Dynamic indicator was invented by John R. McGinley, a former editor of the Market Technicians Association’s Journal of Technical Analysis and a Certified Market Technician.
The indicator itself is relatively new. It came from McGinley’s efforts in the 1990s to design a responsive indicator capable of adjusting itself to the market’s speed. Hence, the name “dynamic.” The McGinley Dynamic indicator was first published in the Journal of Technical Analysis in 1997.
Many traders, analysts, and market experts refer to the McGinley Dynamic Indicator as “the most reliable indicator, you have never heard of.”
Similar to MAs and other indicators, the McGinley Dynamic isn’t intended to be used on its own. It is advisable for the best results to complement it with other indicators, such as the MSI, RSI, MACD, etc.
You might also enjoy:
- Treasury Securities – Learn What They Are and How to Trade Them
- What is Short Selling? │ Examining a Popular Trading Strategy
The Theory Behind the McGinley Dynamic
First of all, let’s say a few words about moving averages and their deficiencies. This will help us better understand the entire theory behind the indicator.
There are two main types of moving averages, a simple moving average (MA) and an exponential moving average (EMA). The former takes past closing prices and divides them by the number of periods to smooth out the price action. For example, a 10-day MA takes the past ten closing prices and divides them by ten. The smoother the line, the slower it reacts to prices. That is why longer-term MAs move slower than shorter-term ones.
On the other hand, the EMA is the more complete indicator since it responds to prices way quicker. The reason is, it puts more weight on the latest periods, rather than the older ones.
What both indicators fail to do, however, is to adjust for the speed of the market. This leaves traders wondering whether to use a 10-day, 20-day, or 50-day moving average in both fast and slow markets. In other words, they might apply the indicator inappropriately, thus miss out on crucial market information.
McGinley wanted to change that by designing an indicator that adjusts to the current market speed. His end goal was to ensure that the indicator’s line “hugs” the price line. Doing so would reduce price separation and whipsaws in both fast and slow markets.
Another important thing is that the McGinley Dynamic indicator overcomes the lag from the fixed-period time model that standard moving averages employ. In today’s markets, prices react extremely quickly to events. Because of that, the dynamic indicator is becoming increasingly popular since it reflects that better.
What does the McGinley Dynamic Indicator Tell You?
Similar to moving averages, the McGinley Dynamic Indicator informs you about the average price of the security over a set period of time.
By helping smooth out the noise, the indicator provides a better representation of the market dynamics and the speed changes in the pricing action. As a result, the trader gets a smoother and more responsive line on the chart.
Following the McGinley Dynamic Indicator’s line, you are basically taking the lag out of the equation. At least to the extent possible in today’s markets. Doing so allows you to have a more informed analysis. That’s because it will be based on accurate price action information, adjusted to the speed of the market.
This is essential since the market’s speed is never consistent. It can slow-down or speed-up several times per session. The result may be a complete distortion of the pricing information generated by traditional moving averages. The McGinley Dynamic Indicator automatically adjusts to the speed and provides a much fairer representation in trending and ranging markets.
However, it is worth noting that the problem of price lag can never be eradicated entirely. Some amount of lag will always be present in your pricing information. Yet, the McGinley Dynamic indicator is the most capable tool we have on hand to smooth it out. It helps provide a more accurate market-reactive representation of pricing information.
According to McGinley himself, the Dynamic indicator is intended to serve only as a smoothing mechanism. He advises traders to avoid using it as a signal generator or a standalone tool to build their trading strategies around.
McGinley Dynamic Formula and Calculation
The formula for the calculation of the McGinley Dynamic Indicator is as follows:
MDi = MDi-1 + [Close – MDi-1 / N × (Close / MDi-1)⁴ ]
Where:
- MDi – Current McGinley Dynamic
- MDi-1 – Previous McGinley Dynamic
- Close – Closing price
- N – the MA period
At first glance, the formula might look complicated. However, the calculation of the indicator is pretty straightforward.
You may see another version of the formula with an added parameter “k” in the denominator in some textbooks. It looks like this:
MDi = MDi-1 + [Close – MDi-1 / k × N × (Close / MDi-1)⁴ ]
Where:
- k – constant 60% of the selected period N
The thing that might confuse you a bit is the idea of “k” being a certain percentage of “N.”
The relationship between both parameters defines how closely the Dynamic indicator tracks the instrument’s price. For example, if you want to emulate a 20-day MA, you should set the “N” at half the period, or, in this case – 10. The “k” will then equal 60%.
The fact that “k” isn’t included in the universal formula is because its value is constant and adjusts automatically.
In the end, it all comes to the fact that you can customize the whole indicator through the value you set for “N.” No matter the formula.
The way the indicator is calculated defines one of its notable characteristics. It speeds up in bear markets and slows down in bull markets. The reason is that, in general, traders want to sell as quickly as possible when the market goes down and ride the wave as long as possible when it is going up.
How to Set Up the McGinley Dynamic Indicator
The set-up of the McGinley Dynamic Indicator is simple and straightforward on practically every trading platform or charting software.
After you select the indicator, the only adjustments you will have to make is for the value of “N” in the formula. This defines the number of periods. As we mentioned already, if you want to replicate a 20-day MA, you should set the length for the McGinley Dynamic to 10.
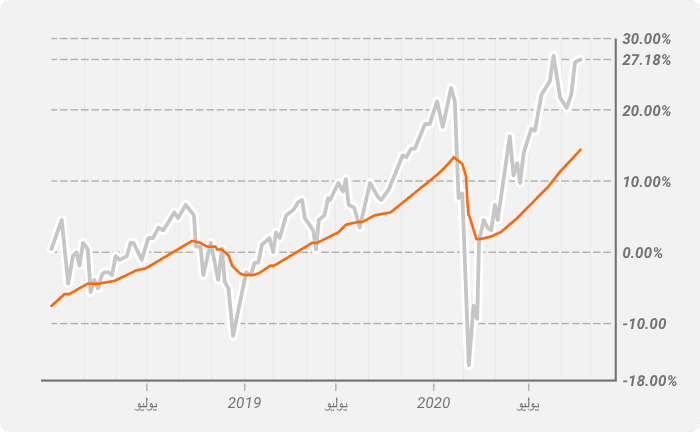
Usually, on most platforms, the default value for the “N” is set at 14 periods. Here is how this looks on a 1-week SPX chart:
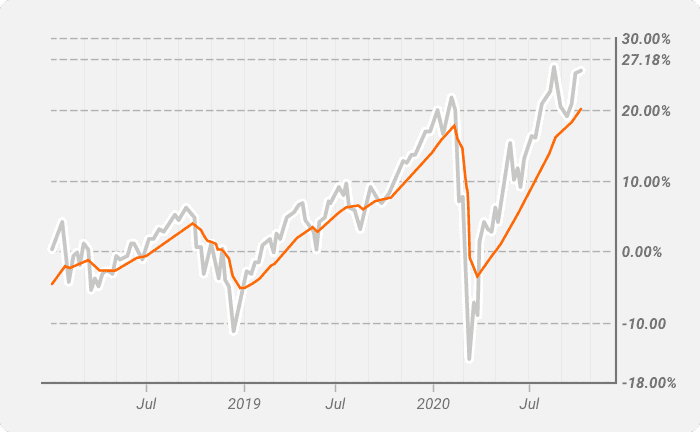
If we change the default value to 7, then the McGinley Dynamic line “hugs” the price action. It starts following it much more closely. This means the indicator gets more sensitive and better replicates shifts in the market’s direction.
Feel free to adjust the length based on your preferences and trading style.
Enough with the indicator’s set-up. Now, let’s now focus on how to analyze the McGinley Dynamic on a chart to help us spot uptrends, downtrends, and reversals:
Spotting an uptrend
An uptrend is potentially in the cards when the price crosses the indicator line from below and remains above it. The indicator line should continue its steady upward movement.
Once traders get a confirmation from complementing indicators, they may consider closing their sell positions and going long.
Spotting a downtrend
On the contrary, a downtrend might be around the corner once the price crosses the McGinley Dynamic line from above and remains below it while the indicator proceeds its downward movement.
Again, trading solely on this information isn’t a viable strategy unless you confirm the signal with other indicators. If it turns out the signal is trustworthy, you might consider closing your buy positions and prepare for the bear market by opening selling positions.
Spotting a trend reversal
In situations where you notice an excessive deviation between the price bars and the indicator’s line, then a trend reversal might be looming.
Before taking any actions, though, make sure to confirm the signal with other indicators.
In the example below, you will see how uptrends, downtrends, and reversals look on a chart. For easier comprehension, the price is displayed as a blue line (instead of bars). Meanwhile, the McGinley Dynamic indicator is plotted as an orange line.
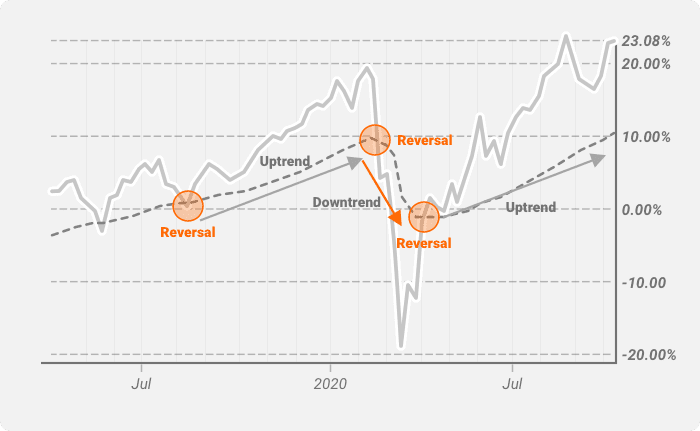
You can also use the McGinley Indicator to spot sideways markets. They occur when the line remains horizontal for an extended period of time. In sideways markets, it is usually better to avoid excessive trading activities.
How Does McGinley Dynamic Compare to Other Indicators?
To truly understand why many traders consider the McGinley Dynamic an “underrated indicator”, we should explore how it compares to other popular technical trading tools like moving averages. We also need to take a look at how it can improve your trading efficiency in combination with the MACD or RSI.
Although it might often be the superior indicator, it is worth noting that it isn’t flawless. You should always complement it with additional tools. As with any price-tracking indicator, use it predominantly when the market is stable.
McGinley Dynamic vs. Moving Averages (SMA, EMA, and WMA)
Today’s markets are moving at a much higher speed than a few decades ago. This means it is essential to use indicators that acknowledge that fact and adjust for it.
SMA, EMA, and WMA fail to do that. They only provide isolated price information without taking into account market dynamics. Understandably, in turbulent market conditions and periods when there is a continuous shift between bearish and bullish short-term movements, the indicators may paint a false picture.
Besides, the moving averages are based on past data. This means they can’t reflect the current dynamics.
Many traders consider the McGinley Dynamic indicator superior because it adjusts to the market speed shifts and acknowledges market acceleration and deceleration. As a result, the indicator projects smoother and more precise lines.
All-in-all the McGinley Dynamic tracks the market much better than moving averages. It generates clear and responsive data. The result is more comprehensive MA lines.
McGinley Dynamic and MACD
Traders often use the indicator in addition to the Moving Average Convergence Divergence, since they perfectly compensate for each other.
When applied on a chart, the McGinley Dynamic will smooth the line that traditional EMAs usually generate. Meanwhile, the MACD will help confirm a long-term trend.
You will get an additional confirmation for the long-term trend if the Dynamic slows down (bullish trend) or speeds up (bearish trend).
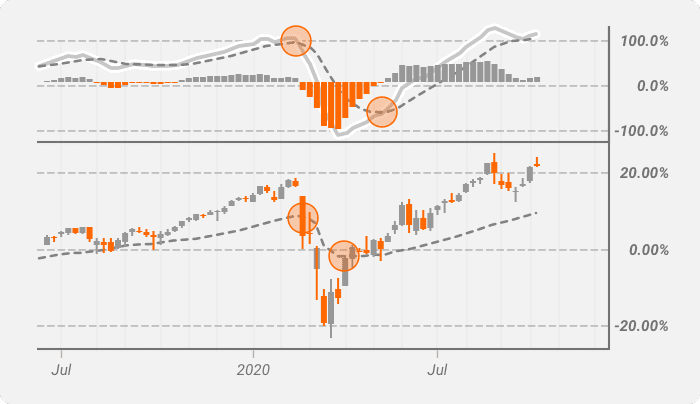
In scenarios like these, traders wait until the MACD crosses the signal line, and the candle body closes on the same end of the McGinley Dynamic for at least two consecutive trading periods. If it meets this condition, they can open a short or long position, depending on the situation.
The best use of this combination is for long-term positions or swing trading strategies. However, it lacks leading indicators. If you want to spot a potential reversal, you might consider adding such (Fibonacci retracements, Support and Resistance levels, etc.).
If you are a scalper or an intraday trader, you can consider swapping the MACD with the TDI (Traders Dynamic Index).
McGinley Dynamic and RSI
Traders often combine the McGinley Dynamic indicator with the Relative Strength Index for easier identification of buy and sell signals.
However, here, instead of looking for the moment the RSI line breaks the 30 and 70 marks, we should focus on its movement around the 50-line. Although according to the conventional RSI theory, situations where the line levitates around the 50-mark, are considered “no signal”, when combined with the McGinley Dynamic, the case is quite the opposite.
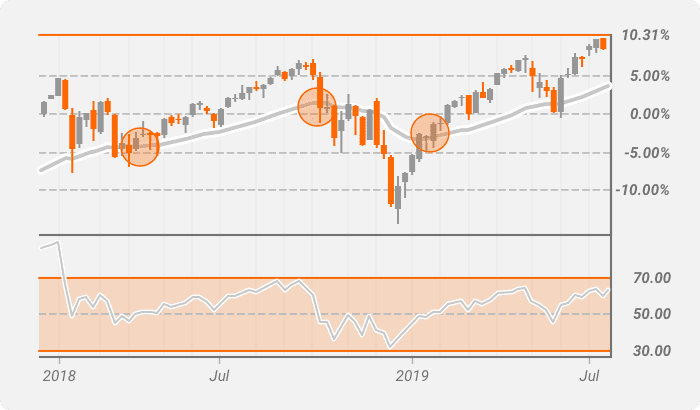
On the chart above, we are looking at situations where the price closes above the McGinley Dynamic line. If the RSI for the particular period is above the 50-mark, then technical traders would consider it a buy signal.
On the other hand, if the price closes below the McGinley Dynamic line and the RSI is below 50, it is considered a good time to sell.
Stop losses are placed around the swing low and swing high points, respectively.
Should you Use the McGinley Dynamic in Trading?
We started by saying that the McGinley Dynamic is one of the most underrated and unpopular indicators. Yet, it is among the most reliable and functional.
This basically answers the question. You should definitely add the McGinley Dynamic indicator to your technical trading toolbox.
It will allow you to make your strategy whipsaw-proof and give you a fair representation of the market dynamics tied closely to the price. It won’t require you to make adjustments depending on whether the market is fast or slow. Instead, it will automatically speed up or slow-down in trending and ranging markets to ensure the most accurate reflection of the price action.
Think of the McGinley Dynamic Indicator as a car with an automatic transmission. It takes into account the speed of the vehicle and adjusts the gears accordingly.
The McGinley Dynamic is very useful for beginners or inexperienced traders because it highlights the risk of a down market. By moving faster in bearish markets, the indicator effectively warns the investor about its consequences. This, in turn, usually turns out to be much more devastating to retail traders.
On the other hand, it eases the anxiety traders might experience during bull markets when they wonder how long they should stay before selling and capturing their profits. When the market is going up, the indicator slows down. This provides traders with the opportunity to settle and develop the necessary dynamic to ride the wave as long as possible.
Besides, should you decide to use the McGinley Dynamic indicator, you will ensure that you’re protecting your strategy from pricing lag as much as possible. You will get a fair, flexible, and timely reflection of the market dynamics. It also accommodates speed, which is otherwise impossible to guarantee with the traditional moving averages.
Final Thoughts
The McGinley Dynamic indicator is superior to most comparable technical trading tools. That is why you should definitely consider equipping your trading strategy with it. We can say that many experts even consider it more of a market tool rather than just a simple indicator.
No matter how you define it, though, in the end, it takes the best of both worlds. It combines the popularity and proven usefulness of moving averages, combined with a much-needed adjustment factor. The result is a tool that responds much more accurately to raw data. It also provides the trader with a highly-efficient smoothing mechanism.