
The world of momentum indicators has so much to offer that traders often feel confused about the best tools to enhance their performance. The on-balance volume indicator usually is among the first that comes to mind, and rightly so. As an indicator based on volume flow information, it is a useful tool to help traders forecast the expected security price changes and capture their momentum. In this guide, we will get to the core of the OBV indicator by focusing on how to use it, its pros and cons, and how it compares to other indicators.

What is The On-Balance Volume Indicator (OBV)?
The on-balance volume indicator (OBV) is a momentum indicator that uses volume flow information to help traders better predict stock price changes. Another way to look at the OBV indicator is to reflect the way the crowd sentiment predicts the bullish or bearish market outcomes. Alternatively, how to measure the buying and selling pressure.
The indicator was introduced by Joseph Granville back in 1963. He published the concept in his book “New Key to Stock Market Profits,” where he analyzed the importance of volume for tracking the changes in security prices.
The concept for the indicator is based on the idea that when there is an increase in trading volume, even if it doesn’t affect the price at first, at some point, it will. The price will then go up or down, depending on what types of orders prevail.
When the indicator was first introduced, it was considered something revolutionary. Even today, it remains widely popular among technical traders. However, as soon as market volume became a target for manipulations, the principles most volume indicators are based on started losing their usefulness.
Today, traders also use the on-balance volume indicator as a tool to help them find out when institutional and retail investors are present on the market. It also lets them distinguish the volume generated by either group. If, for example, the volume increases, but the price remains relatively flat, at first, it is considered an indication that pension and mutual funds might be buying the instruments retail investors are selling. Once the price follows the volume and goes up, institutional investors start selling, while retail investors start buying.
You might also enjoy:
- Treasury Securities – Learn What They Are and How to Trade Them
- What is Short Selling? │ Examining a Popular Trading Strategy
Understanding The OBV Indicator and How it Works
To help you understand what the OBV indicator really is, let’s take a look at the way it works.
First, let’s start by saying that the OBV indicator is a cumulative indicator. This means whenever there is a change in the instrument’s price, the volume is adjusted in the cumulative OBV total.
For example, if the price increases, the volume is added to the OBV. Meanwhile, if the price drops, the volume is subtracted. There is also a third scenario where the price remains stable. In that case, no volume is added or subtracted.
Depending on the market’s state, the value of the OBV can be either positive or negative. Positive values are recorded when today’s price exceeds the closing price for the previous day, while negative values appear when today’s price is below yesterday’s closing one. The OBV indicator can also be seen oscillating around the zero line.
However, because of how the on-balance indicator works, traders don’t actually care so much about its actual numerical value. What traders look at is the nature of the indicator’s movement and the slope of the line. Here is how the OBV indicator is plotted on a chart:
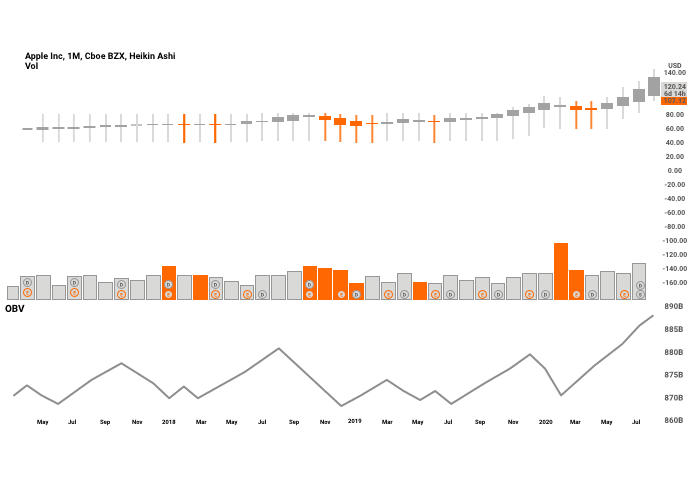
The OBV is displayed as a blue line at the bottom of the chart. You can see the numerical value for the indicator as well, although it isn’t considered as important. It is advisable to focus on the line’s slope and its overall direction instead. That’s because they better indicate the buying and the selling pressure.
The OBV’s idea in a nutshell: The price of the instrument should follow the trading volume.
On-Balance Volume Calculation
Formula
The formula we use to calculate the on-balance volume indicator is pretty simple and straightforward:
OBV = OBVprev ± trading volume
where:
- OBV: the current level for the on-balance volume indicator
- OBVprev: the level for the on-balance volume indicator for the previous day
- Trading volume: the latest trading volume that can be positive/negative or zero
Calculating it
Calculating the OBV is, in fact, very easy if you know how to deal with the relationship between the closing prices of two consecutive trading days.
There can be three different scenarios depending on the price relationship; today’s price can be higher, lower, or equal to yesterday’s one. Here is how the OBV indicator formula looks like in all three scenarios:
When today’s price is higher than yesterday’s one:
OBV = OBVprev + Today’s volume
When today’s price is lower than yesterday’s one:
OBV = OBVprev – Today’s volume
When both prices are equal:
OBV = OBVprev
Here is an example of a hypothetical stock price and trading volume to illustrate how those calculations work in practice:
- First day: closing price of $50.00, with a trading volume of 10 000 shares
- Second day: closing price of $50.10, with a trading volume of 12 500 shares
- Third day: closing price of $50.15, with a trading volume of 11 000 shares
- Fourth day: closing price of $50.14, with a trading volume of 14 000 shares
- Fifth day: closing price of $50.14, with a trading volume of 12 000 shares
From the example above, we can see that days two and three are up days, while the rest are down days. The up days’ volume is added to the OBV, while the down days’ one is subtracted. Here is how the OBV will look for each day, based on the data above:
- First day OBV = 0
- Second day OBV = 0 + 12 500 = 12 500
- Third day OBV = 12 500 + 11 000 = 23 500
- Fourth day OBV = 23 500 – 14 000 = 9 500
- Fifth day OBV = 9 500
As you can see, because on day five, the price didn’t change, the OBV remains equal to the previous one.
How to Use On-Balance Volume
Traders nowadays use the on-balance volume indicator to identify trend confirmations, trend reversals (divergence), oversold and overbought markets, etc.
Earlier we mentioned that traders use the OBV indicator to spot institutional and small investors’ presence. Now let’s get practical and see how you can capitalize on it.
The best way is to look for divergences between price and volume. These divergences can help technical traders recognize two upcoming market moves:
- Spot price decreases – when the trading volume goes down without a simultaneous price decrease;
- Spot price increases – when the trading volume goes up without a simultaneous price increase;
Should you spot such situations, it is an indication that there might be opportunities to buy/sell against incorrect prevailing trends.
The most basic way to capitalize on these situations is by selling when you see the volume going down, without being followed by an immediate price drop. Alternatively, you can buy when you see the trading volume going up, without a follow-up price jump. The OBV indicator suggests that the price will soon follow the volume in either scenario.
Sophisticated institutional investors take this type of strategy to another level. They artificially drive the price up just for the small investors to follow and add to the prevailing trend. Retail investors often don’t want to lose out on capitalizing on potentially stable market momentum. That is why they join the crowd once the price starts going up. And this is when institutional investors start reaping profits by selling to the retail investors who had just joined the bandwagon.
Learning to apply the OBV indicator for the identification of such practices will help you stay away from such unstable and artificially-influenced trends.
What Markets Does The OBV Indicator Work In?
It is worth noting that, similar to other popular volume indicators like the Klinger volume oscillator, the negative volume index, and the money flow index, the OBV indicator works only on markets with associated exchange volume. In most cases, this means lit markets and official venues.
The trader shouldn’t rely on the OBV indicator as to the core pillar of their strategy. It is just a tool to complement a stable and time-tested strategy. Trading on volume analysis on its own isn’t viable in today’s markets.
Setting It Up In Your Charts
As a volume-tracking indicator, the OBV comes ready to go and doesn’t require any particular adjustments. The settings are pre-defined since the on-balance volume automatically adjusts its values based on the automated calculations it makes.
However, you can always change the color or the thickness of the indicator’s line if you find this important for smoother user experience. For example, if the line is green by default and you prefer looking at plain candlesstick charts, you might want to change the line’s color to avoid confusing situations.
For your convenience, you can also change the position where the OBV box appears on your chart to make for better management of your trading workspace.
You should make sure when setting up the on-balance volume indicator on your chart to avoid analyzing it within lower time frames (under 4 hours) because those have high volatility, which can add unnecessary noise.
Divergence
Recognizing trend divergences is an essential skill to possess if you want to navigate the trading world successfully. The OBV can help in that regard. It can indicate whether the price of the instrument you’re trading is about to reverse or continue the trend.
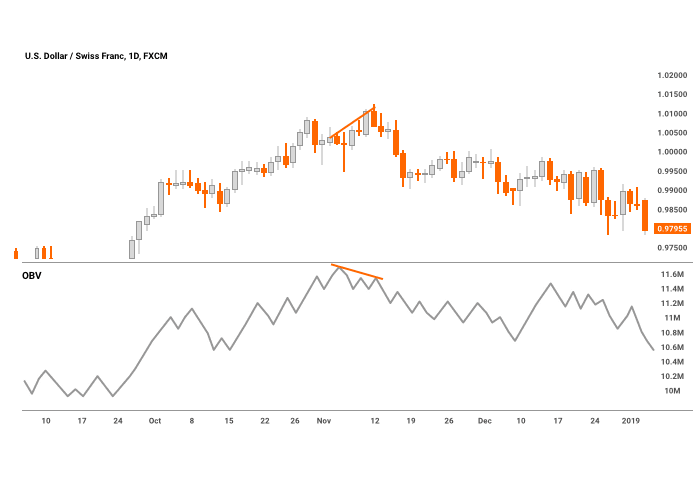
Here is how this works in practice. In an uptrend, we have a divergence when the price hits higher highs, but the OBV records lower highs. This is called a bearish divergence. Here is an example:
Meanwhile, in a downtrend, a divergence occurs when the price marks lower lows while the OBV hits higher lows. This is what we call a bullish divergence, and you can see it in the example below.
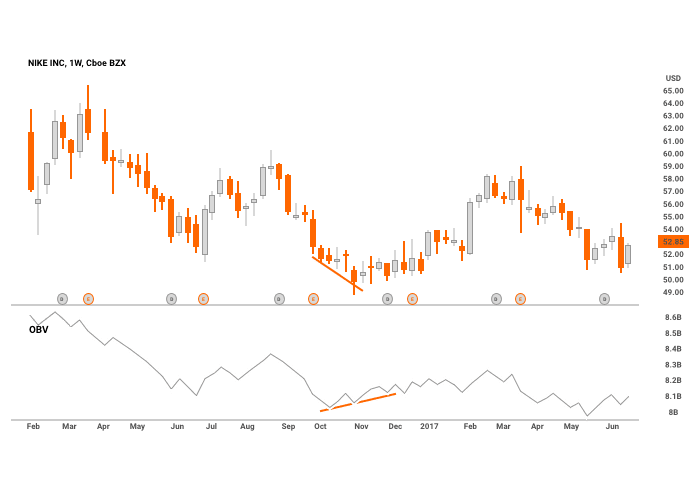
When the OBV hits a lower high, it means the bulls are getting weaker, indicating growing selling pressure. On the other hand, when the OBV hits a higher low, it means the bears are losing momentum, and the buying pressure is starting to build up.
These discrepancies between the price and the volume can help you forecast upcoming trend reversals. Looking solely at the price, you may assume that the trend is about to continue, but if you throw the OBV in the mix, as well, you can get an additional sign that the price direction is about to change.
Trend lines / Trend Confirmation
The ones who often use the OBV are traders looking for trend confirmations or trying to correctly identify the strength and the direction of the on-going trend.
The reasoning here is simple, if a particular asset’s price is rising in harmony with the volume, you have a confirmation that the trend is stable. For example, if you see a price uptrend reflected in the volume, then the theory suggests you should expect the trend to continue further.
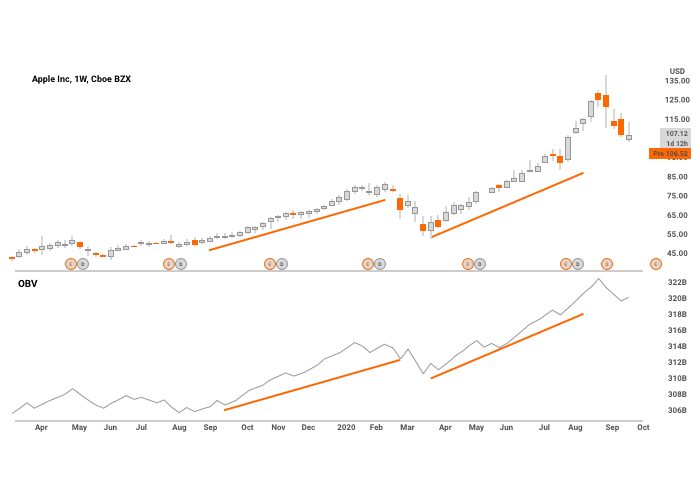
It is also useful to consider the OBV line’s slope. A trend accompanied by an OBV line with a steeper slope indicates it is growing stronger, and new market participants are looking to enter the market.
Also, keep in mind that if the change in the slope is too drastic, it can also indicate a trend approaching its end. The reasoning here is that market psychology shows traders tend to be most positive when the trend nears its end because of the built-up recent market moves in the direction of the trend. In that sense, a too steep OBV line signals the market sentiment is getting too positive or too negative. Hence, a reversal might be around the corner.
To provide further confirmation, the original developer of the OBV indicator and most of the traders applying it suggest combining it with a 20-period MA.
On-Balance Volume Trading Strategies
The fact that the on-balance volume indicator is such a simple and straightforward, yet powerful tool makes it a popular choice for all types of traders. From beginners to professionals, every market participant recognizes the benefits of complimenting a trading strategy by adding a trading volume indicator.
What all these traders have in common is the simple trading rule: always follow and trade in the direction of the OBV indicator.
Let’s take a look at some of the most widely-adopted trading strategies based on the OBV indicator.
Identifying breakouts
Although not advisable, some prefer trading just combining the price trend and the OBV indicator. This can prove an easy-to-apply and relatively sound strategy when looking for breakouts.
To do that, traders start by identifying powerful support and resistance levels. In many instances, the OBV can help confirm a breakout even before the price goes up/down. The reason is that volume is often a clear representation of the buying/selling pressure and factors traders’ behavior before the price starts to reflect it.
Here is how the strategy looks on a chart. As you can see, the OBV breaks the channels before the price does. A few moments later, the price follows and establishes a clear upwards trend.
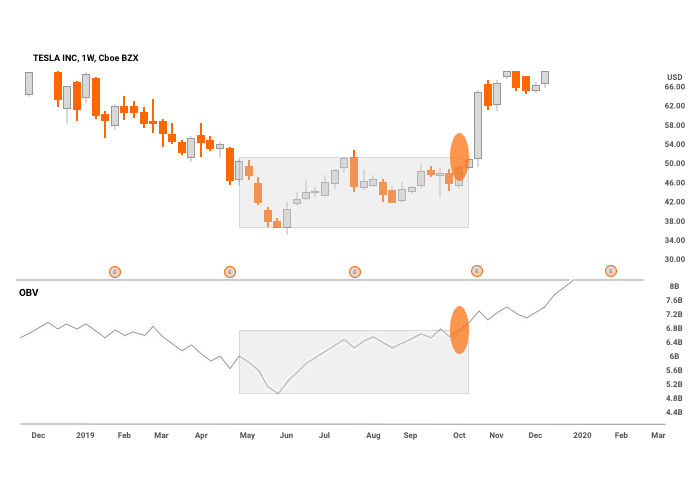
Traders who use the OBV to spot breakouts proceed by opening a position at the price level where the breakout occurs, as forecasted by the volume indicator. Finally, they complement it with a tight stop loss (above/below the most recent swing). This can lead to a small but stable profit.
The volume indicator also helps identify false breakouts. False breakout situations occur when there is a declining volume or even a little increase over a breakout. This indicates a lack of interest and should serve as a warning sign for a higher probability of a false breakout.
This strategy even works with asset classes where the price tends to range for too long, and traders are at risk of losing concentration.
Identifying exhaustion moves
Volume can help traders identify scenarios where market participants are losing momentum, and a stable shift in the trend’s direction is about to take place.
These situations are what we usually call a bull or bear exhaustion. They are typically followed by divergence. The idea is that a rising market should be accompanied by an increasing volume. That is because to keep pushing the price up, market participants require increasing enthusiasm.
Traders apply the OBV indicator to identify overbought and oversold markets with a strong tendency to revert to the mean. To do that, traders look at the discrepancy between the OBV line and the price trend. If the trend has moved too much in either direction, while the OBV is lagging or moving in the opposite, experienced traders consider this a good moment to enter.
Here is how to trade it. When the price is making higher highs, but the OBV marks lower highs, there is a good chance you will see a price reversal. However, it isn’t advisable to trade such signals right away. The best thing is to add an oscillator to help you confirm your entry.
In the example below, a valid signal is a close of the price below the lower trend line of the upwards channel. If the OBV also confirms it, you can open a short position once the price closes below the trend line.
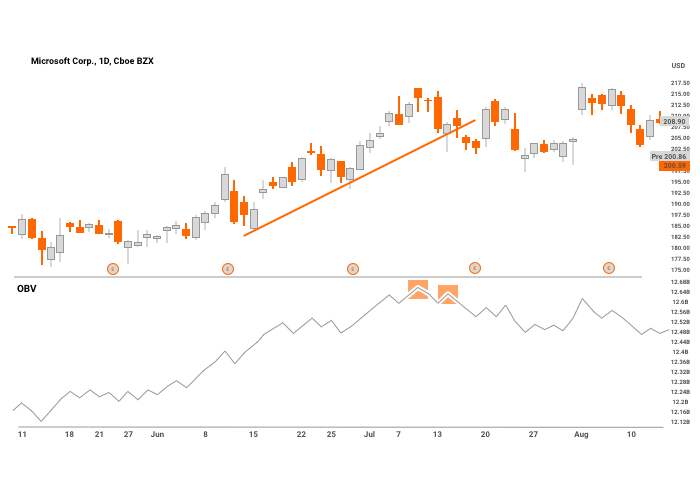
However, to apply this move, it is essential to keep in mind that a price change on a little volume isn’t a strong signal. It is always better to act on a price change on a higher volume. That’s because this indicates that something has changed fundamentally.
Trading Examples Using On-Balance Volume
Let’s now look at an example of how to use the on-balance volume to spot situations where the trend bounces off the general price line and reverses its movement. For the purpose of this example, we will use the GOOGL stock.
To better forecast the shifts in the price direction, we pair the OBV with a 20-day moving average. As you can see, the OBV follows the MA very closely in some parts of the chart. In others, it is way off. The reason is that we chose a widely volatile period for the particular instrument. In general, when you analyze bigger time frames (over one day), the volatility will be lower. This means using the two indicators should go hand-in-hand.
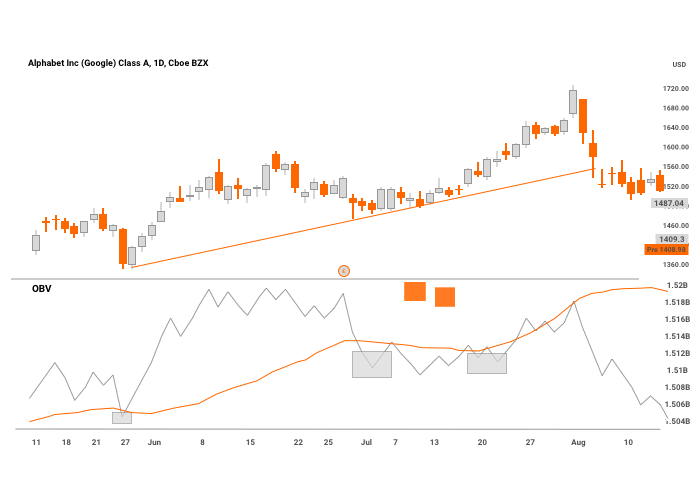
Every time the on-balance volume indicator goes below the MA and then moves back above it, the price rejects from the trend line. This leads to a new bounce and an upward move.
Advantages & Disadvantages of Using The OBV Indicator
Although arguably the most popular volume indicator, the OBV isn’t exactly flawless. It has its positives but also has some notable downsides. Some of these can prove costly to the trader if he doesn’t take them into account before building his trading strategy.
Let’s take a look at the clear advantages and disadvantages of the on-balance volume indicator. These will help you find out whether it is worth to include it into your trading plan:
Advantages of OBV
Simple and easy to use even for beginners
Everything from the calculation to the way it is plotted and the signals it generates can be learned in a matter of few trading sessions. Of course, you will have to master it over time to better distinguish institutional from the retail volume. There may also be fake signals and inflated order flows. However, overall it is safe to say that the OBV is among the most beginner-friendly indicators.
Works in all markets
The on-balance volume indicator is time-tested and proven to work in all markets, be it equities, fixed-income, futures, FX, cryptocurrencies, etc. The only condition is for the market to have associated exchange volume and to analyze on longer time-frames.
The best tool to complement a trading strategy with volume-based signals
Most traders consider the OBV the most popular among all volume indicators. It is a real-time indicator, which means it is among the day traders’ favorite tools. Long-term investors also use it. So do professionals who want to further complement their analysis by adding some volume-based insights.
Disadvantages of OBV
Volume these days is prone to manipulation
Market makers and high-speed traders can often inflate the volume numbers by generating fake orders and canceling them right before execution. A massive spike in trading volume can throw the indicator off for a while. If you rely solely on it, it may deceive you into rushing your trading decision because of a false trend.
Requires blind trust
The OBV is a leading indicator, which means it produces signals, but doesn’t reveal much about them. The information is limited and the trader can’t analyze the factors that lead to a particular signal. For example, the OBV adds/subtracts the same volume regardless of the price movement. Whether it is a few cents or a few dollars.
Because of this, we consider the indicator inconclusive in terms of price analysis data. This means the trader has to take a leap of faith on each generated signal.
Can’t be used as a standalone metric
Although this can be said for pretty much all indicators, with the OBV, it is, even more, the case. Due to the lack of conclusiveness for volume analysis, traders should often complement the indicator with others, for example, by adding an MA line to the OBV to look for breakouts.
The Difference Between On-Balance Volume and Other Indicators
The on-balance volume indicator is, arguably, the most popular volume trading indicator. Many traders consider it among the most reliable ones as well.
To determine whether this really is the case, the best thing to do is compare it with the alternatives and find out the main differences.
On-Balance Volume vs. Cumulative Delta Volume
One of the indicators traders often compare the OBV to is the cumulative delta volume indicator. However, aside from being volume indicators, they don’t have many other similarities.
While the OBV factors all volume, the cumulative delta volume indicator reflects only the volume that occurs on the bid and ask sides. It does so by taking the delta values for all bars and combining them together to create a graph. The indicator is useful when the trader tries to identify the buying and selling pressure at different price levels (i.e., swing highs and lows).
Think of the OBV as the more complete indicator and of the cumulative delta volume as the niche indicator. While the OBV provides you with a broader snapshot, the cumulative delta indicator shows only the extremes.
Order flow traders find both indicators useful and may apply each depending on the situation.
On-Balance Volume vs. Accumulation/Distribution
The OBV indicator is similar to the accumulation/distribution one in the sense that they are both momentum indicators and help spot the presence of institutional investors on the markets. Aside from that, though, the indicators are quite different.
The main difference is the way we calculate the two. In the case of the OBV, you add the up-days’ volume, while subtracting down-days’ volume. In the case of accumulation/distribution, the formula takes the position of the current price relative to its most recent trading range and multiplies it by the volume for the particular period.
This means the A/D indicator doesn’t take into account the prior close price. It also uses a multiplier based on the exact point within the period’s range the price closed.
The A/D indicator factors in the driving forces behind price movements. However, it doesn’t account for price changes from one period to another. This can create anomalies and deceive traders.
This is not to say that one indicator is better than the other. We just calculate them differently. This means traders can use the signals they generate to confirm or reject one another. If used together, strength in both indicators can signal clear buying pressure. Meanwhile, weakness in both should be considered a sign of selling pressure.
Is it Worth It to Use The OBV Indicator Today?
To answer this question, we should start by focusing on two key characteristics of today’s markets – volume and volatility. Both have come a long way since the time the OBV indicator was proposed for the first time in the 60s.
Today, trading volume and volatility are both growing. The markets have evolved in a way that nowadays we trade more than ever at much more unstable prices.
Now, let’s take a look at what this means in the context of the OBV indicator.
While the OBV indicator can work in both low- and high-volume markets, it can’t be relied on during volatile periods. Short-term price spikes or dives, flash crashes, trades cancellation – all these factors typical for nowadays’ markets affect the trading volume and destabilize prices. This can drive the OBV out-of-bounds and lead to increased generation of false signals.
As we have seen during the Flash Crash, even a retail trader can destabilize a whole asset class by generating artificial trading volume from his computer. Today, markets have evolved technologically but are more fragile.
The on-balance volume is worth using today if you apply it together with other indicators. That way, it can help better identify trend reversals, confirmations, or divergences, thus complementing your trading strategy.
However, in the context of today’s market environment, it isn’t worth using on its own. Using the OBV as the only indicator to base your strategy on is a recipe for disaster.
F.A.Q
Let’s tackle the most popular questions regarding the on-balance volume indicator and its application:
A negative on-balance volume means two things – 1) today’s price is lower than yesterday’s closing price; 2) today’s trading volume is higher than yesterday’s trading volume. A negative on-balance volume usually signals an increased selling pressure and a potential bearish trend.
The on-balance volume is most accurate when the market is stable. Like when the volatility levels are low, and most importantly when you apply it on longer time frames. The indicator can help identify trend reversals or confirmations. However, you should not rely on its signals as your sole reason to trade. The OBV is most accurate when you apply it alongside other indicators.