
The parabolic SAR indicator is among the most popular technical trading tools. It helps traders by highlighting the direction an asset’s price is moving and identifies the perfect entry and exit points. In this article, we will cover everything about the indicator, including how to calculate it, the best settings, the most popular trading strategies, how to incorporate it into your trading plan, its drawbacks, and most importantly – how traders can use it to identify buy and sell signals.

What is the Parabolic SAR Indicator?
The parabolic SAR is a time and price indicator in technical trading. It’s used to identify the direction of the asset’s price and the best entry and exit points. It is also used to highlight stops and reversals (i.e., when the direction of the asset’s price is likely to change). SAR is short for “stop and reversal system”. It was developed by J. Welles Wilder Jr., whom you might be familiar with from our article about the Relative Strength Index (RSI).
On a chart, the parabolic SAR is visualized as a sequence of dots next to the price bars. The reason it is called “parabolic” is because the resulting dots tend to form the shape of a parabola. The type of the trend determines the location of the parabola. It is located below the price during bullish trends, while during bearish trends, it stands above it.
Like any other technical indicator, the parabolic stop and reversal should be used in addition to others. Often, the trading signals it generates aren’t enough to confirm a particular move’s potential, which is why it is complemented by the moving average, stochastic, ADX, or other indicators.
Before we dive deeper into the exploration of the buy and sell signals generated by the indicator, it is important to mention that the parabolic SAR works mainly in trending markets. According to its father, J. Welles Wilder Jr., traders should use the indicator to identify the trend’s direction and then switch to alternatives to help them measure its strength.

You might also enjoy:
- Relative Strength Index (RSI) – What is it and how to calculate it?
- Fundamental Analysis – A Complete Guide from Basic to Advanced
Buy Signal
Parabolic SAR’s buy signals are generated when the dots are located below the price bars. However, the indicator doesn’t only generate signals when it is static (continuously moving below the price), but also when it changes position. For example, if the dots are above the price (bearish trend) and flip below it, it means that you could expect a potential change in the price’s direction.
In the example below, you can see a zone where a crossover takes place. The bearish SAR changes its location, and the dots flip to below the price bars. This means a price reversal is imminent and you can consider it a buy signal.

Also, bear in mind that the movement of the dots is also linked to that of the price. If it goes up, the dots follow. The interesting thing here is that the dots’ movement is slow, at first, but as the trend develops, it speeds up and soon catches up with the price.
However, make sure to use the parabolic SAR in addition to other indicators. In the graph below, you will find a combination of the parabolic stop and reverse and the 200-day moving average. When the price of the instrument is moving above the 200-day MA the buy signals generated by the SAR are considered reliable.
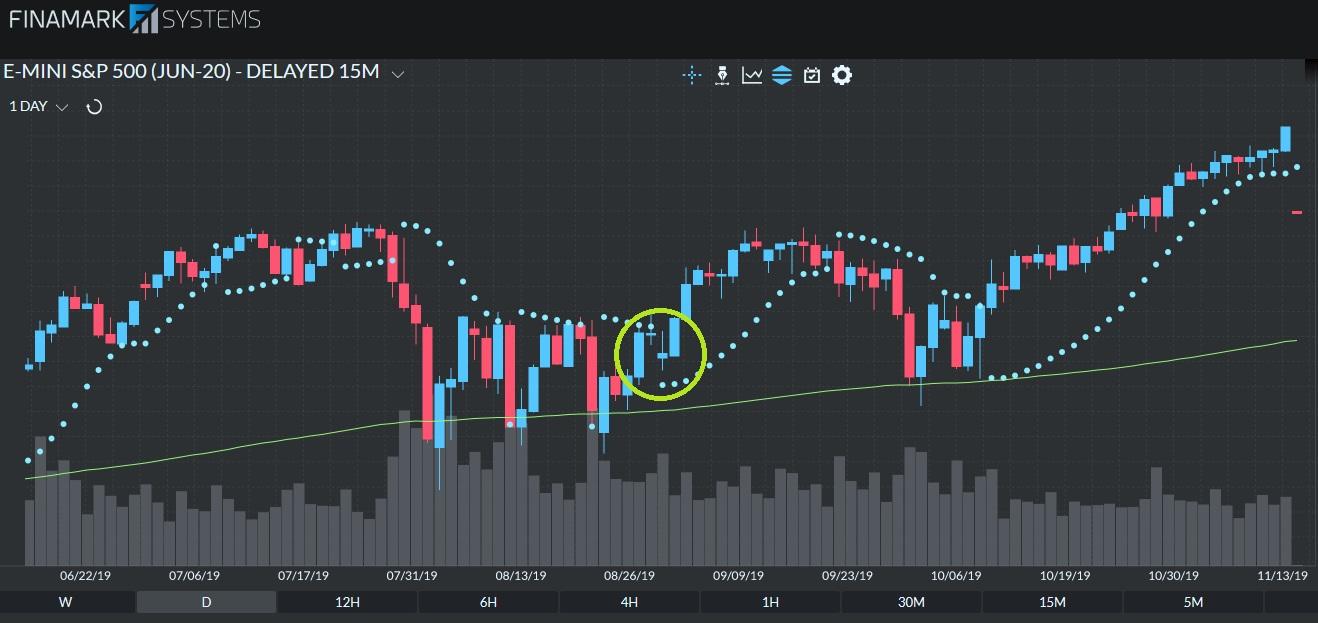
You can use the indicator as a sign of where to put your stop-loss. The best thing to do when the trend is bullish is to match your stop-loss with the parabolic SAR’s position.
Sell Signals
The sell signals are generated when the dots are located above the price bars. The earlier the momentum is caught, the better price you can sell at. To capture the momentum and maximize your returns, make sure to keep an eye on the moment the dots flip. As soon as the indicator switches to a position above the price, consider it an indication of a change in the trend. This is generally the best moment to sell your assets.
In the example below, you will see the exact situations when such a switch in the indicator’s position occurs. The crossovers in green visualize the moments when the bullish trend turns into a bearish one. The best place to sell your assets is usually at the beginning of the switch. After that, the bullish momentum accelerates, and the profits start shrinking.
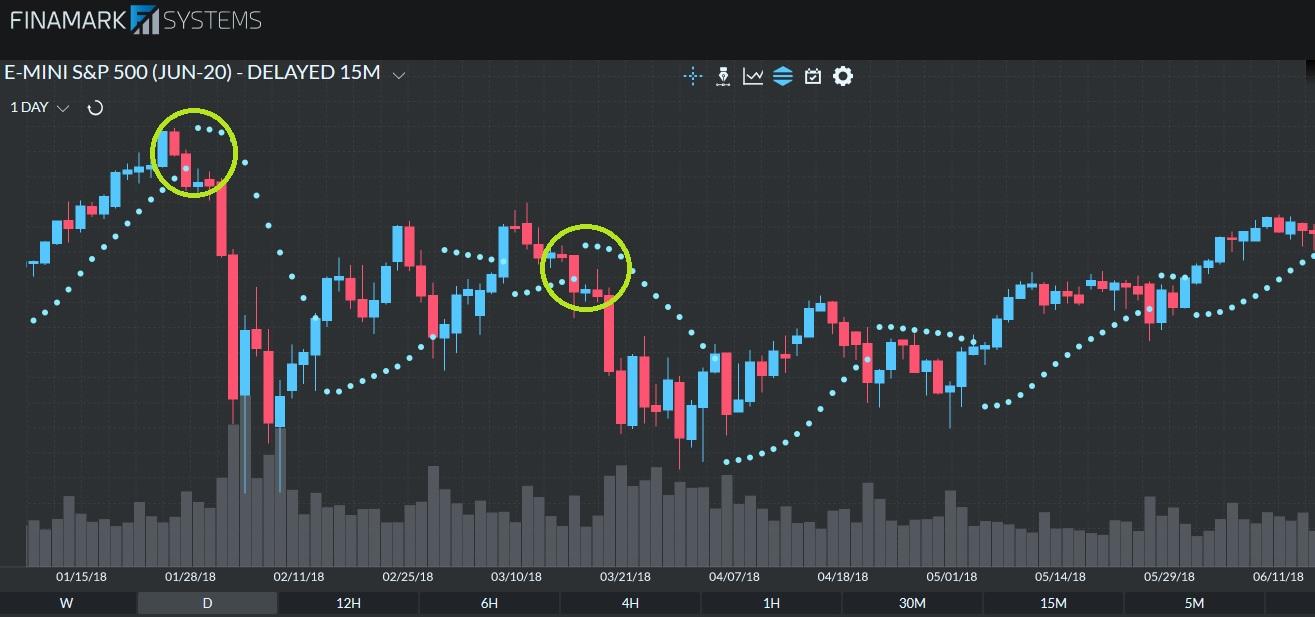
The sell signals generated by the parabolic SAR are more convincing when the price is below a long-term moving average. This means bears control the market, and the expected short-term market direction is suitable for selling your assets.
When it comes to positioning your stop-losses, bear in mind that as the price goes down, the same will soon happen with the indicator. That is why you should make sure to move your stop-loss to match the level of the parabolic SAR after each price bar.
Parabolic SAR Formula and Calculation
The parabolic SAR indicator is calculated differently depending on the type of the current trend. However, what is common in both cases is that the indicator uses the lowest and the highest prices in combination with the acceleration factor to estimate the indicator’s position.
Uptrend: PSAR = Prior PSAR + Prior AF * (Prior EP – Prior PSAR)
Downtrend: PSAR = Prior PSAR – Prior AF * (Prior PSAR – Prior EP)
Here are the variations of the parabolic SAR formula, used in both markets. The constituents of the formulas mentioned above are:
- EP (extreme point) – during an uptrend, it is the highest point reached by the price, while during a downtrend it is the lowest price point.
- AF (acceleration factor) – describes the rate of acceleration of the indicator and can influence how closely it resembles the movement of the price.
Don’t worry if you find other interpretations of the formula either. You may see it presented in the following way:
SARn+1= SARn + α (EP – SARn)
Same as above except the way the constituents are named. The acceleration factor, for example, is marked by α.
The idea here is simple. The values for the first day (trend reversal or market entry) are the ones of the previous EP (highest or lowest point, depending on the trend). If the trader enters a bullish trend, then the EP is the lowest price point reached during the previous short trade. On the other hand, if he enters a bearish trend, then the EP is the highest price point reached during the last long trade. The calculation for the second day is done via the corresponding formula, depending on the type of the trend.
Parabolic SAR Settings
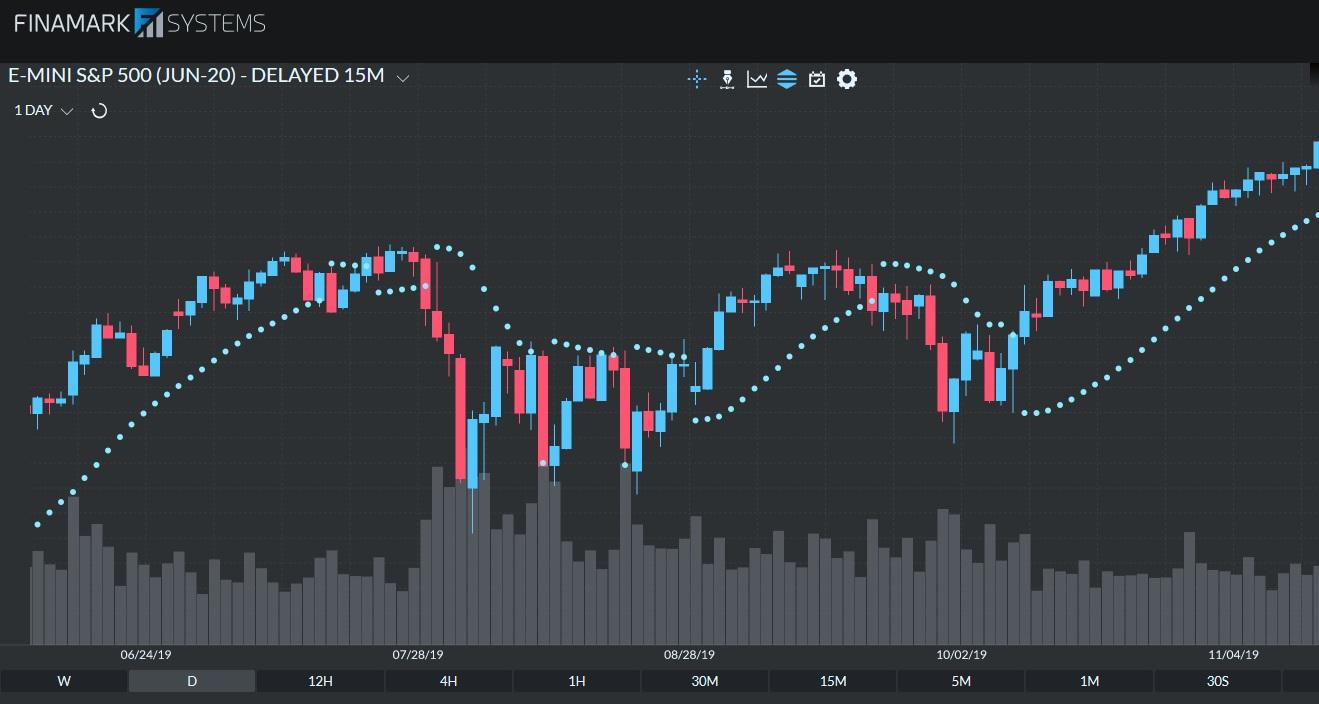
The standard settings for the indicator include a Step value of 0.02 and Max Step of 0.2. On the Finamark platform, traders are also free to modify the dots’ style to make them stand-out easily when looking at the chart.

Below is an example of the way a parabolic SAR with standard settings looks like on a 15-minute chart of the E-mini S&P 500.

These settings are recommended for everyone who is just starting or doesn’t have a specific, time-tested trading strategy that requires otherwise.
However, depending on their style, trading interval, or instrument, some traders use custom settings. The goal is to adjust the indicator’s sensitivity and bring it closer to the one of the assets they are trading.
For example, when the asset is more volatile, the SAR’s sensitivity can be increased by increasing the Step value. This will bring the indicator closer to price action, and allow it to capture more reversals. If the value of the Step is too high, however, the indicator will reverse way too often, which will create whipsaws and false signals.
On the other hand, to decrease the sensitivity, the trader should lower the value for the Step.
Below is an example of the indicator with a Step value of 0.08 and standard Max value. Bear in mind that this is a massive increase and is done only to better visualize the dots and the way their position gets closer to the price bars.

The indicator’s sensitivity can also be customized through the Maximum value. If it is lowered, then the indicator will catch fewer reversals.
Parabolic SAR pros and cons
Like any other trading indicator, the parabolic SAR isn’t perfect. It has its flaws, as well as advantages. Here is a list of the main pros and cons:
Pros
- A perfect solution for steady trends – the indicator can be of great help in stable markets as the signals it generates can be on point, especially when combined with the ADX momentum indicator.
- Great visualization for the strength of the trend – through the distance between its dots, the indicator does a great job of helping traders measure how strong the trend is. When the gap widens, the trend gets stronger. When it narrows, the trend gets weaker.
- A great choice for active traders – the parabolic SAR is very sensitive, which means it can identify lots of trading opportunities. This makes it perfect for active traders, particularly day traders, who focus on catching high-momentum moves and make immediate exits to capture steady profits.
Cons
- Shouldn’t be used on its own – although this isn’t something new for technical indicators, in the case of the parabolic SAR, it is of even greater importance. Make sure to combine it with a long-term moving average, stochastic, ADX, etc.
- Can create false signals – due to its nature, the indicator can often create premature signals. Before making a move, it is advisable for traders to wait for a confirmation. Otherwise, they risk opening positions with a low chance of success.
- Isn’t effective in sideways markets – the indicator isn’t of much help when the market is choppy or moves sideways. This can result in misleading buy/sell signals and keeping the trader in a trade when he should have closed it or vice-versa.
Conclusion
In a nutshell, the parabolic SAR is a great indicator that helps traders gauge the price of a particular instrument and find the best place to set their stop-loss orders. It is of great help in strong markets and can significantly benefit active traders who seek a high-sensitivity indicator that can generate multiple buy and sell signals per trading session.
Now, after you know what the indicator is, how to calculate it, what its best settings are, and what drawbacks and advantages it has, you can make it a part of your arsenal of trading tools. Most importantly, don’t hesitate to combine the Parabolic SAR with other indicators like the MA, stochastic, or the average directional index (ADX), to maximize the efficiency of your trading strategy.
F.A.Q
To use the parabolic SAR effectively, you should, first of all, know which are the best settings. It is advisable for beginner traders to use the default values for the acceleration factor (starting value of 0.02; maximum value of 0.2). Experienced traders can modify these settings according to their trading style or the specifics of the traded asset.
The next step is to keep a close eye on the buy and sell signals. Make sure to act on them only when there is a clear and stable trend (and no sideways market moves) or when you combine the parabolic SAR with other indicators to strengthen the accuracy of the generated signals.
There are no specific instructions on where to get the data for the first price bar indicator, not even in Wilder’s “New Concepts in Technical Trading Systems” book, where it was introduced in 1978. Therefore, the practitioners decided to assume that the first bar’s data can’t be calculated as there is no previous information.
The indicator is calculated one period in advance. This means, for every subsequent bar, the trend is defined either as bullish or bearish by being compared to the values of the previous one. Then, the estimation for the parabolic SAR is made based on the formula described above. In a nutshell, tomorrow’s SAR is based on today’s data.
The trend changes when the dots of the parabolic SAR switch positions. For example, if the indicator is below the price bars and moves above it, this is an indication of a bearish trend. On the contrary, if the indicator is above the price bars and flips below it, then the expected trend is bullish.