In this article, we will take a look at the concept of price action trading. It will include different trading strategies and how to read charts. This will assist in reading futures, commodities, and index movements and creating your own price action trading strategies. There are numerous trading strategies, many of which depend on technical analysis or individual investor opinions. Price action trading incorporates both of these strategies; technical analysis to identify support/resistance levels and individual investor opinions that can vary greatly. We will also look at several price action charts with historical patterns, including patterns that often repeat themselves time and time again.
What is Price Action?
It’s a favorite amongst short to medium-term traders. Price action trading brings together an interesting mix of information and different views. These include historical price patterns, technical indicators, and the investor’s ability to read the markets. Many investors see the stock market as an “information exchange” where all views and strategies meet and try to arrive at a “fair price” in the end. This explains why price action trading strategies do not involve fundamental analysis of an individual market/commodity.
A prudent speculator never argues with the tape. Markets are never wrong, opinions often are.”
– Jesse Livermore
As many of the decisions associated with price action trading are subjective. What one investor may see as a breakout, another may see as a potential price reversal. Compare and contrast this with pure technical analysis where you effectively ignore investors’ experience in favor of cold hard trends. Human nature dictates that futures/commodity prices can be extremely volatile. Overbought situations are often created as a consequence of fear and greed, while panic selling can take over in the event of disappointing news. These are the type of scenarios where price action investment strategies can prove extremely lucrative.
You might also enjoy:
- Automated Trading Software (EAs) – Should You Trade With Robots?
- Trailing Stop Order – What Is It and How Does It Work?
How to Read Price Action Charts
The key to reading price action charts is to take in short-term fluctuations. It’s also critical to notice emerging trends and focus on patterns that repeat time and time again. You will hear talk of swing patterns, support and resistance, wave analysis, trendlines, and moving averages, to name but a few different chart patterns. Candlesticks and bars are also very popular.
For example, when a chart is about to crash through a support level, it is unlikely to do it in one fell swoop. You may see an index/commodity contract price initially bouncing off the support level as investors look to benefit from the short-term sell-off. As short-term traders sell into the bounce, buying interest begins to wane, and sellers again take control. Eventually, the price will crash through the support level, often prompting an array of short-selling. Next, let’s take a look at a few trading strategies based on various chart patterns in more detail.
Types of Charts
There are many different types of chart patterns we associate with price action trading. Some of these are fairly obvious, while others are open to interpretation. The following charts have been simplified to make a point. Once you understand what they really mean, you will start to notice many of them on the charts you look at every day.
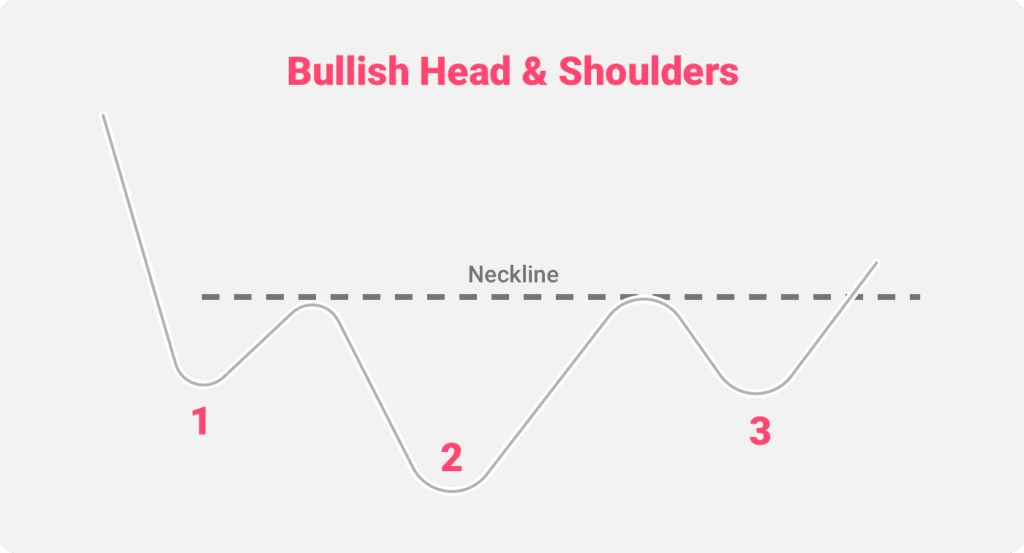
Bullish Head and Shoulders
This chart illustrates an initial sell-off and then a period where buyers and sellers alternate control. Eventually, active shorters close their positions and panic sellers bail. Slowly but surely, the buyers regain control of the contract price until it eventually breaks through the neckline resistance. We can attribute the first rebound in the contract price to “bottom-fishing.” That is the point where sellers who failed to act on the initial fall take advantage. When looking at this kind of chart pattern, it also helps to keep an eye on trading volumes. Very often, you will see huge volumes towards the bottom of a downward trend. This typically indicates that an upturn is just around the corner.
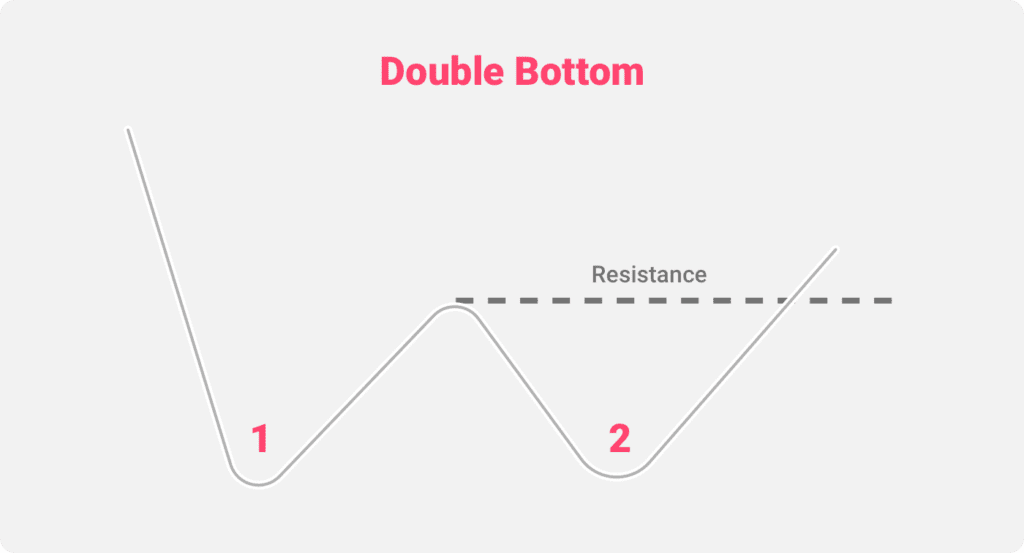
Double Bottom
The double bottom trend is fairly straightforward. It is as closely related to technical analysis as it is to human nature. The initial large fall in price will tempt those closing short positions and those looking for a short-term bounce. After the initial bounce, those sellers who missed out on the previous downturn are determined not to miss out again. They push the price down to create a double bottom. There is an indication of support around the level of the two low points with a gradual recovery back towards the resistance level. What typically happens is that the initial sell-off goes overboard, and buyers return right after. This pushes the price through the resistance level and back towards previous levels.
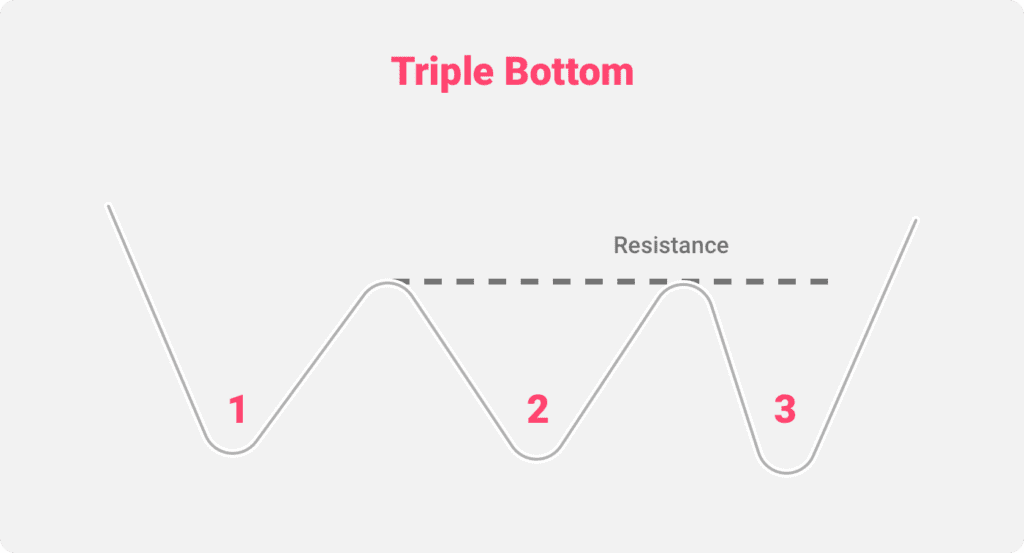
Triple Bottom
In layman’s terms, this pattern seems very similar to the last one. However, when seen through the eyes of a price action trader, they tell a different story. This trend indicates significant selling action from the initial fall and those taking advantage of short-term rallies. These rallies push the contract price towards a resistance level which initially still holds. Due to a mix of stale bulls finally giving up on a price recovery, traders closing short positions, and new buyers, the momentum begins to swing strongly behind an upturn.
A clear positive indicator for many price action traders is when the price breaks the resistance level. However, those who saw the emergence of a triple bottom earlier may well have started buying on the earlier dips. You will regularly come across the term “buying on the dips.” It indicates that the buyers are slowly but surely drawing out the sellers after a downturn.
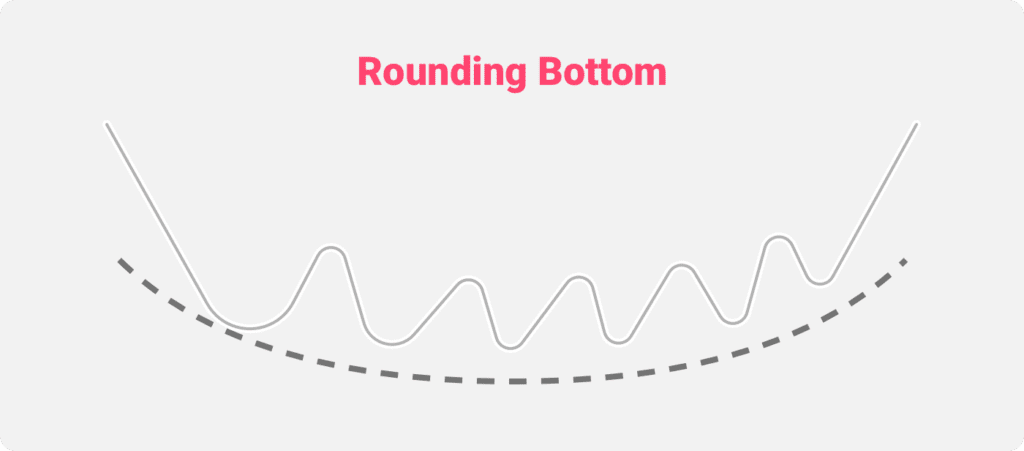
Rounding Bottom
While some of the earlier price action trends were much more pronounced and less varied, the rounding bottom chart trend can be a little bit more difficult to spot. After the initial sell-off, there are various relatively small rebounds before the sellers regain control. This is demonstrated by the falling lows. At least until the price hits rock bottom towards the middle of the chart. This then prompts a rally with rising highs perfectly reflecting growing investor demand. The resistance level is a straight line between the far left and far right recovery highs. Once the price powers through that level, the buyers are in full control, and earlier sellers are left floundering.
If the initial trend of falling lows continued, it would’ve indicated sellers were disposing of their investments at the first sign of a recovery. Depending on how long the pattern continues, this could lead to another sharp sell-off with a support line drawn across the falling lows.
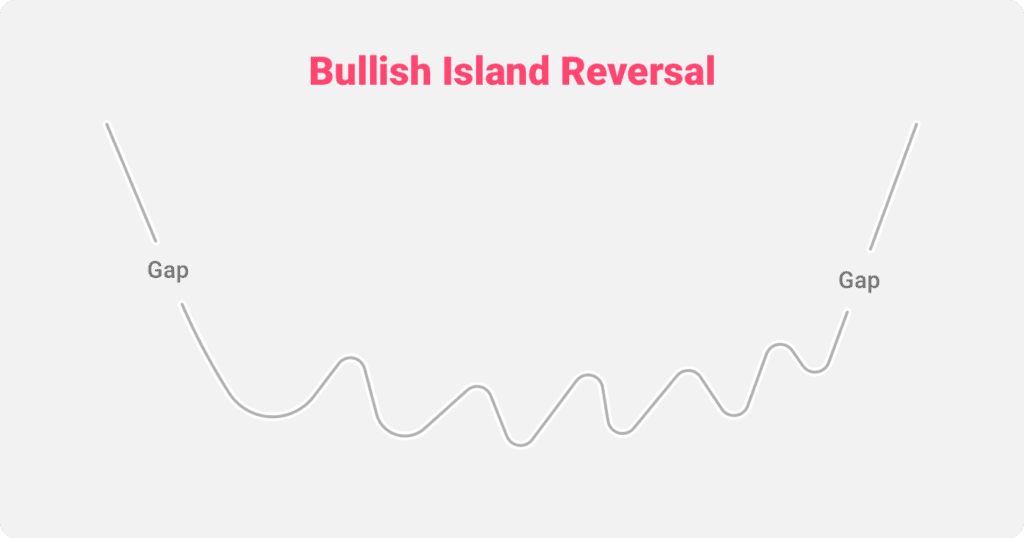
Bullish Island Reversal
The bullish island reversal chart pattern can be a difficult one to read in the early stages. The initial fall followed by a period of price fluctuation can easily turn into a bullish trend line, double or triple bottom. However, in this instance, the initial contract price fall creates confusion, with buyers more interested and sellers uncertain. This type of pattern often emerges when short sellers decide to err on the side of caution and close their positions. That together with “bottom fishers,” can prompt a sharp upward movement. A period of sideways trading is not necessarily exciting for those using price action strategies. However, once the price breaks through, the support level interest renews.
In this instance, the second stage of the chart trend is similar to a rounding bottom where buyers and sellers fight to gain control. Eventually, there is a breakout on the upside. That said, uncertain investors may decide to take profit after the initial burst – and stale bulls finally exit. This then creates a sideways trading pattern. Bulls buy on the dips, looking to acquire cheap assets, while uncertain sellers take advantage of the upward rebound. Once the stale bulls and short-term traders have been taken out, the next leg of the recovery comes into play.
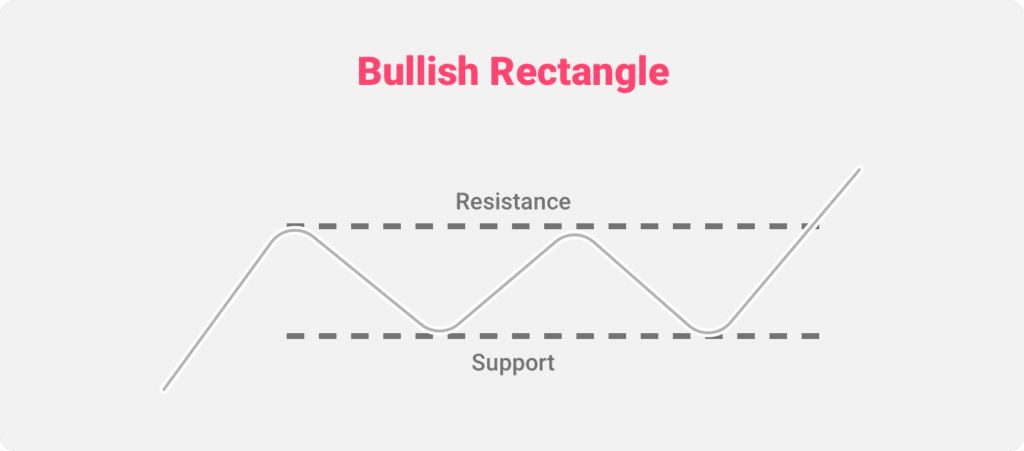
Bullish Rectangle
This is a fascinating trend that perfectly illustrates that a bull run on a commodity price does not generally go up in a straight line. In various stages of the long-term bull run, those who acquire a lower down will be tempted to take profit. Meanwhile, those who missed the initial rally will look to buy on weakness. This creates a near-perfect period of sideways trading, with the price oscillating between resistance and support with no clear direction. In this particular scenario, eventually, the bulls take control of the day, breaking through resistance and moving into new higher ground.
The share price could easily have taken a further downturn if the support line had been breached before the two occasions when the price bounced higher. This is a perfect illustration of how price action trading strategies are very much removed from fundamentals. They basically just play on new emerging trends.
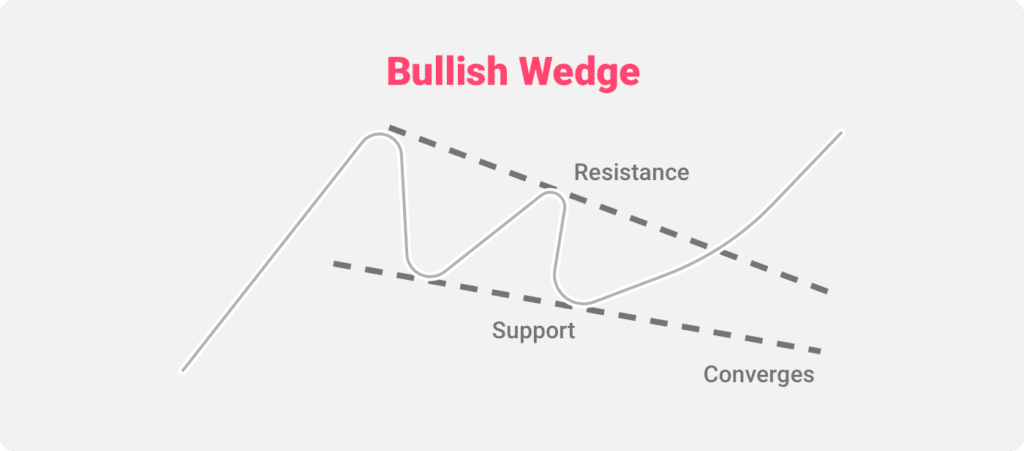
Bullish Wedge
Traders call this chart trend a bullish wedge because eventually, the share price breaks out into new ground and moves higher. However, it is also a powerful indicator of a bearish period in the early stages. As you can see, once the share price turns after the initial rise, the gap between the short-term highs and short-term lows begins to decrease. The line at the bottom is the support, and the line at the top is the resistance. Due to their angles, they will eventually meet with one of them taking control. You will often see the downward restricted trading range continue until the support and resistance trend lines almost meet. A breakthrough in the support level would indicate another sell-off, while in this instance, a breakthrough the resistance introduces a new uptrend.
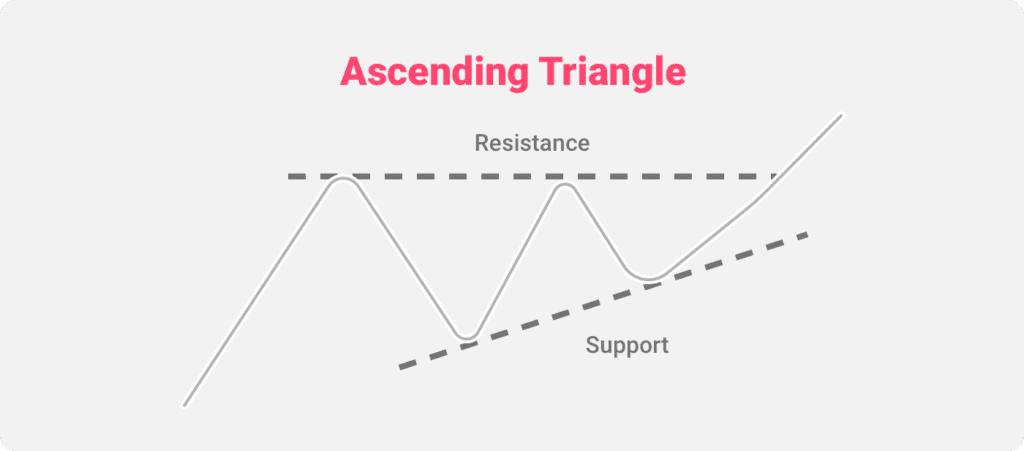
Ascending Triangle
This is another exciting trading trend. An initial rally is hit by profit takers. This causes a short-term downturn before the buyers re-emerge. The interesting element of this particular pattern is the rising lows while the resistance continues to hold at a fixed level. This indicates that not only are there fewer sellers, but buyers are content to buy at high levels. Their view is that the contract price will eventually break through the resistance level. You will notice that these broadly sideways trading periods see bulls and bears once again battling for control of the underlying contract. Once on higher ground, all bets are off, and sellers retreat as the buyers step forward.
Bullish Flag
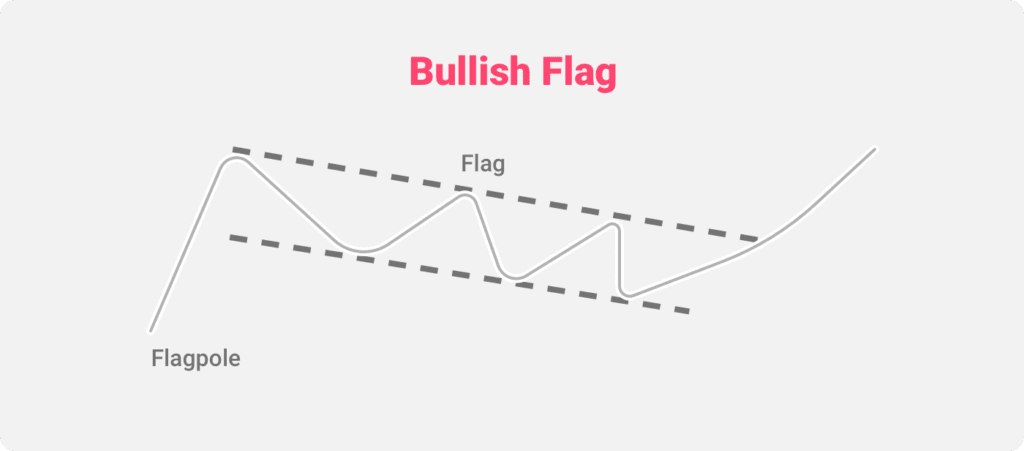
Once the initial rise in this price begins to succumb to sellers, we see the emergence of a new downtrend. The short-term lows continue to fall, as do the short-term highs as the price rebounds begin to weaken. This creates an initially bearish trend from which it can be difficult to escape without a bout of good news. As the short-term highs move lower, this indicates that buyers are unwilling to “pay over the odds” with the price succumbing to sellers. Eventually, the contract will reach an oversold position. What follows is a move outside of the flag range. This draws in price action traders who have spotted the emergence of a new trend.
After most sellers have already left and the shorters close their positions, there can often be immense momentum behind a recovery from this type of oversold position. It is not difficult to see where the term flagpole comes from, at least until the eventual breakout!
Cup and Handle
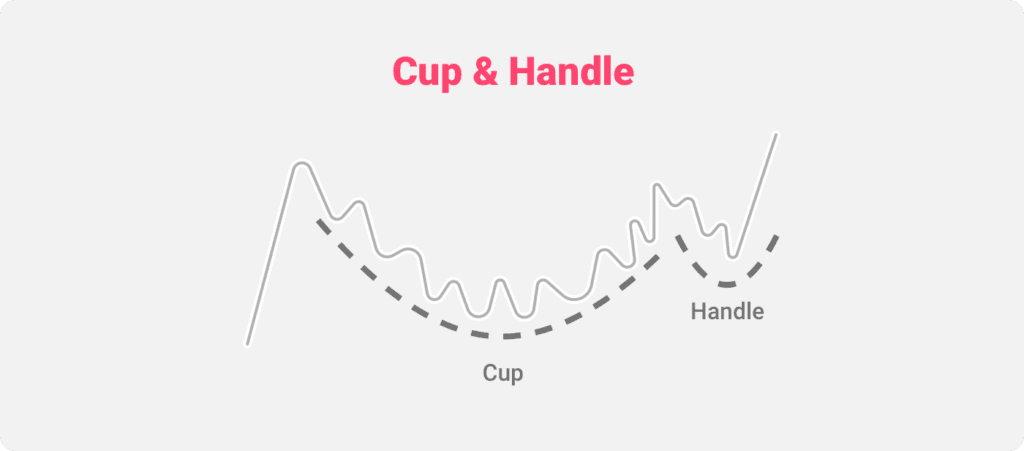
The cup and handle chart trend is a perfect example of a slow burn recovery followed by a sudden pullback when buyers have had their short-term fill. Similar to the bullish wedge, the short-term downtrend suddenly breaks, leading to a sharp upward spike. This type of chart pattern is fairly common when prices rise sharply. Between the second upward turn, the bears and bulls battle for control, with some investors banking a profit while others look to buy on weakness, believing the uptrend is still in place. Boredom and impatience can often lead to the handle shape before the uptrend, with investors concerned that the price is moving into a downtrend. Once sellers have been taken out, the buyers then take control. This moves the price significantly higher due to a lack of resistance.
These are just a few of the fundamental trading patterns that price action traders use when looking to take advantage of new trends emerging on the upside and the downside. It is now possible to go both long and short on various commodities and contracts. This creates an extremely liquid market. The perfect environment for short to medium-term traders!
Price Action Trading Strategies
The key to any successful price action trading strategy is to remove peripheral noise such as fundamental data and look at price patterns, trends, and other forms of technical analysis. When combined with good old-fashioned experience and “a feel for the market,” this can create a very successful investment strategy. Don’t forget, even if you have opened a position based on any of the following price action trading strategies, you can also use the technical data to set stop-loss limits.
Support and Resistance levels
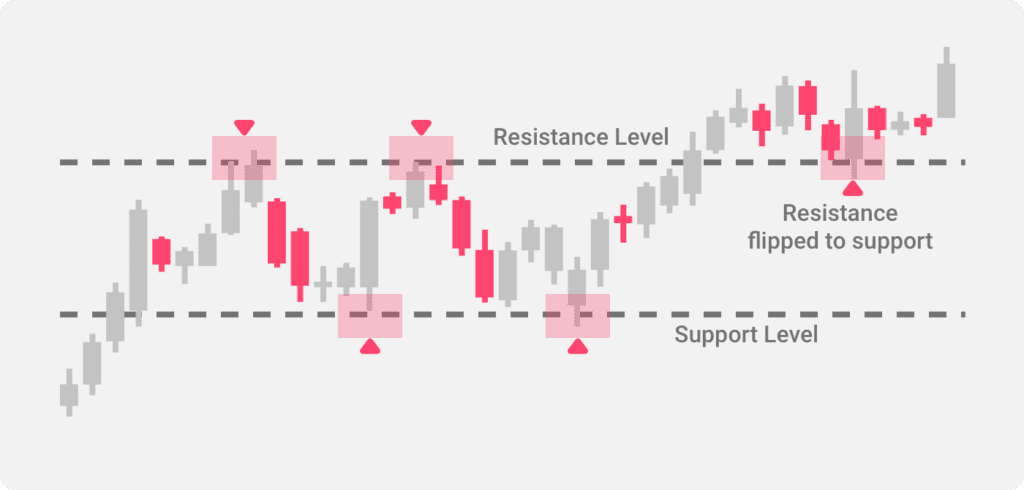
One of the key aspects of price action trading when using support and resistance levels is that once a support level is breached, it can then turn into resistance and vice versa. The following chart shows how chart analysis can change in a relatively short span of time. It is worth noting that while traders tend to focus on volatile periods for contract/commodity prices, the vast majority of the time, they tend to trade sideways markets, all within a relatively modest range.
It is foolhardy to make a second trade if your first trade shows you a loss. Never average losses. Let this thought be written indelibly upon your mind.”
– Jesse Livermore
On the chart below, you can see prices moving in a relatively tight range. It bounces off the resistance and support lines on multiple separate occasions. When the eventual breakthrough did happen, it signaled an uptrend. That trend initially looked as though it was faltering early. However, it then bounced off the previous resistance, which was now a support line, moving even higher.
Inside Bar patterns
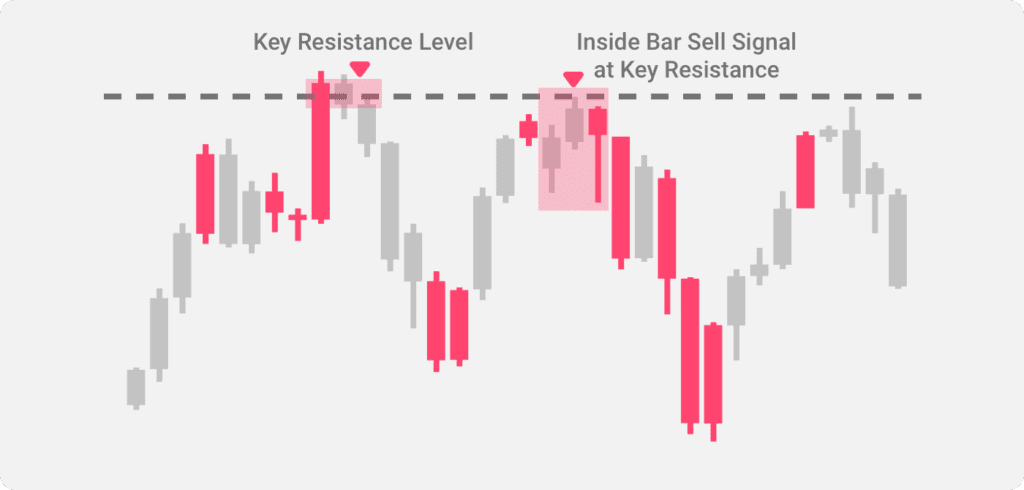
Many price action traders are extremely vigilant. They’re always on the lookout for what are known as inside bar patterns. You can recognize these by the emergence of a secondary bar within the body of the previous bar. Take a look at the examples below:

The primary bar is sometimes described as the “mother bar” and will often indicate a period of consolidation and potential turning points from key support/resistance. You will see on the chart below how the bar indicates a rising price then incorporates two falling bars. This is the beginning of a changing trend and marks a downward movement. To see one mother bar/inside bar occurrence is encouraging. To see two inside bars side-by-side is an even more reliable indicator.
It is only when you take the time to understand how bar patterns emerge and what they indicate that you can position your trades. Don’t forget to also keep one eye on the stop-loss limit.
Pin Bar and Inside Bar combo
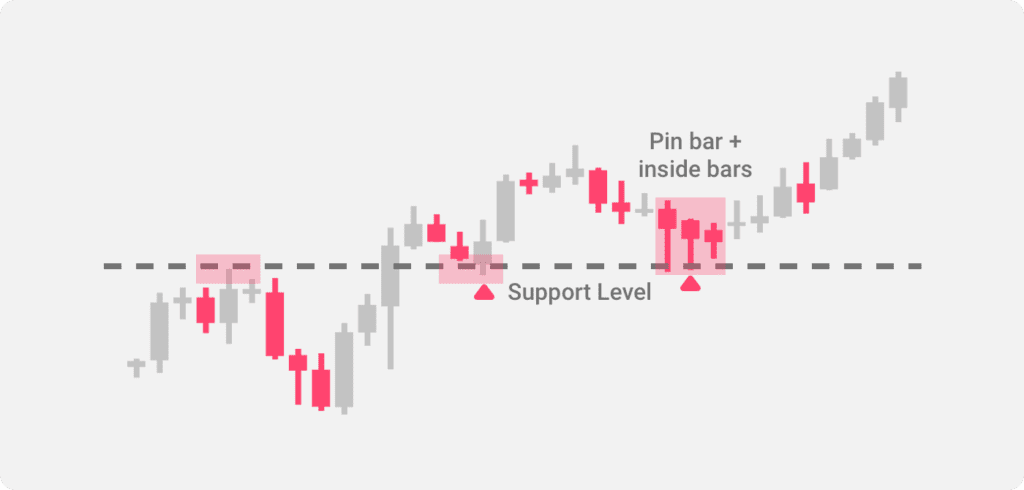
The pin bar and inside bar combo pattern is seen by many as one of the most powerful technical indicators. As you will see from the example below it can also prove extremely lucrative if you accuratelyrecognize it in time. The pin bar and inside bar combination shows what is effectively a short-term sell-off, before the exchange rate consolidates and then moves significantly higher. If you look towards the start of this particular chart you can see the exchange rate bounce off the resistance (later support) level with the pin bar and inside bar combination highlighting the peak.
A basic pin bar and inside bar combo is already a good sign. When you also see the inside bar form within or near to the pin bar nose that is an even stronger signal. In reality the pin bars on this chart are talking to price action traders. Those who learn to understand their “language” can set up some very lucrative trades.
How can Price Action help with your trading?
As you’ll gather from all of the above information, price action trading is based on trends and momentum. The idea is simple, once a trend changes, then the momentum often grows. It is only when a stronger (opposing) trend emerges that the direction changes again. Between these relatively strong trends, there will be periods of consolidation. Often you can also find sideways trading, and prices will often bounce off support and resistance lines. In many ways, support and resistance levels are self-fulfilling prophecies. Many traders now use technical analysis and take them into consideration. However, price action trading offers the best of both worlds with both technical analysis and human input from a trader.
Don’t take action with a trade until the market, itself, confirms your opinion. Being a little late in a trade is insurance that your opinion is correct. In other words, don’t be an impatient trader.”
– Jesse Livermore
Disadvantages of Using Price Action as an Indicator
There are numerous disadvantages and advantages of using price action trading strategies, and ultimately it comes down to how disciplined you are as a trader. Some of the disadvantages include:
Relatively low number of trades
As you effectively wait for the price trend to cut through a support level or shoot through a resistance level, you can end up with a relatively low number of trades. That is not an issue if you are disciplined, but frustration can sometimes get the better of traders!
Waiting for definitive levels
Unfortunately, traders using price action trading are often caught out by significant shifts in the market. This often means prices do not return to their preferred trading levels. Traders lacking discipline can end up “chasing the price” higher and higher. Meanwhile, for those who can remain focused on the technical situation, opportunities will emerge.
Definitive changes in trends
Many of the strategies we mentioned above can be seen as “overly cautious” by some people. When waiting for a definitive change in trend, there may be times when intraday prices could spike above resistance or below support then recover. These could be seen as false flags and can be potentially expensive in the long run.
No fundamental analysis
When looking at chart trends, not all traders will have the same opinion. Some will go long, and others will look to short the market. These decisions are based on their opinion of the technical analysis as opposed to fundamentals. Whether you are actually ignoring the fundamentals is debatable because, in theory, contract prices today should reflect all of the information in the public domain. Basically, let the markets talk and listen to what they are saying.
Price Action Trading Examples
As we touched on above, while price action trading is based on technical analysis and a reading of the situation, it is not always cut and dry. Some examples of price action trading include:
After hitting a new high an exchange rate falls back as a result of profit-taking
While it will depend on the support and resistance levels, one trader may expect a double top and then a move to higher ground. However, a different trader may see this as the start of a new downward trend. In that scenario, continued profit-taking could push the price below the support level.
Low volume sideways trading
One classic indicator that a trend is changing is high trading volume. So, if the price is stuck in a bound range, bouncing between resistance and support under relatively low volumes, one investor may see this as a trading opportunity. While another investor may see this as a lack of interest and assume a likely break through the support level at some point, prompting a strong momentum downward trend.
History repeats itself
In many cases, you will see currency exchange charts indicating historic highs and historic lows. Many of these patterns are very strong, but you will see a significant break out on the upside or the downside every now and again. So, one trader may take a position assuming history will repeat itself, and there will be a ceiling and a floor for the trading price. Another trader may assume that the momentum behind the uptrend is strong enough to push it through historical resistance and into new territory. This move into new territory can often be a breath of fresh air because there are no similar historical trends to compare it against and no resistance to speak of.
F.A.Q
The simple answer to this question is, yes, in the right hands. Price action strategies can highlight periods of consolidation, the emergence of new trends, and phases of sideways trading. The key is to see what’s in front of you instead of trying to manipulate the chart data into what you want to see.
The basic difference is that price action incorporates both technical analysis and human input. Effectively you are monitoring emerging trends and reading these with varying degrees of discipline and experience.
While there is a degree of human input regarding price action trading, there is also a need to be disciplined even if you marginally miss out on several trades. The idea is fairly blunt. When the turning point occurs and momentum builds for a new trend, you will be there!

