
Most intraday traders prefer applying technical analysis techniques in their daily trading activities. Technical indicators are readily available, and we can use them for various asset classes. However, the underlying calculations behind most indicators can be hard to comprehend. Yet, one technical indicator shines in that aspect – the Supertrend indicator. The Supertrend indicator is easy to understand and offers a more straightforward approach to technical trading. It utilizes trend-following like a moving average indicator or MACD (moving average convergence divergence).

Introduction
The article will elaborate on the Supertrend indicator and how to calculate it. It also focuses on the configuration and interpretation of the indicator. We will also go through a real example to demonstrate how you can use the Supertrend indicator to empower your trading decisions.
What is the Supertrend Indicator?
The Supertrend indicator is a technical analysis tool that helps identify strong upward and downward trends. The indicator uses previous prices as input and compares the current price with the indicator’s line to determine the future price trajectory. The Supertrend indicator is beneficial in trending markets but may be an unreliable measure during periods of consolidation. Traders often use it alongside other technical indicators like the Exponential Moving Average (EMA).

How to Calculate the Supertrend Indicator
The Supertrend indicator consists of just two parameters – the time frame and the multiplier. The default setting is usually 10 days and 3, respectively. Since the indicator may be used for placing intraday trades, one can adjust the time frame to a few minutes. A shorter duration is especially appropriate for traders looking to profit from small price movements. Traders having a long-term view might set the time frame to a few days or even weeks.
Calculation
Now we need to construct two lines – an upper and a lower one. You can see the mathematical expression for each line below:
Upper Band = (High Price + Low Price)/2 + multiplier * Average True Range
Lower Band = (High Price + Low Price)/2 – multiplier * Average True Range
Average True Range = (Average True Range for n-1 periods * (n-1) + Current True Range)/n
The two inputs in the above equations are n (time period) and multiplier.
Another vital element in the calculation is the True Range. A normal range is simply the difference between the intraday high and low. On the other hand, the True Range accounts for the closing price for the previous day.
The calculation for True Range is as follows:
True Range = max (High – Low, |Close – High|, |Close – Low|)
Close refers to the closing price of the previous day.
|Close – High| and |Close – Low| measure the absolute value and is a positive number.
The True Range is a better way to account for the volatility in price because sometimes the market may trade above the previous day’s close or below the previous day’s high. Calculating the range without considering the last closing price would lead to a lower volatility figure. For example, if the previous closing price was $100 and the high and low for the day were $110 and $105, respectively. The range would be $5 ($110 – $105).
True Range = max (110-105, |100-110|, |100-105|) or $10, which is $5 higher than the range.
Setting up the Supertrend Indicator
It is straightforward to set up a Supertrend indicator on the chart. Since it uses the same scale as the price chart, the Up and Down bands are superimposed on the same chart. The following figure shows the default setting for a Supertrend indicator.
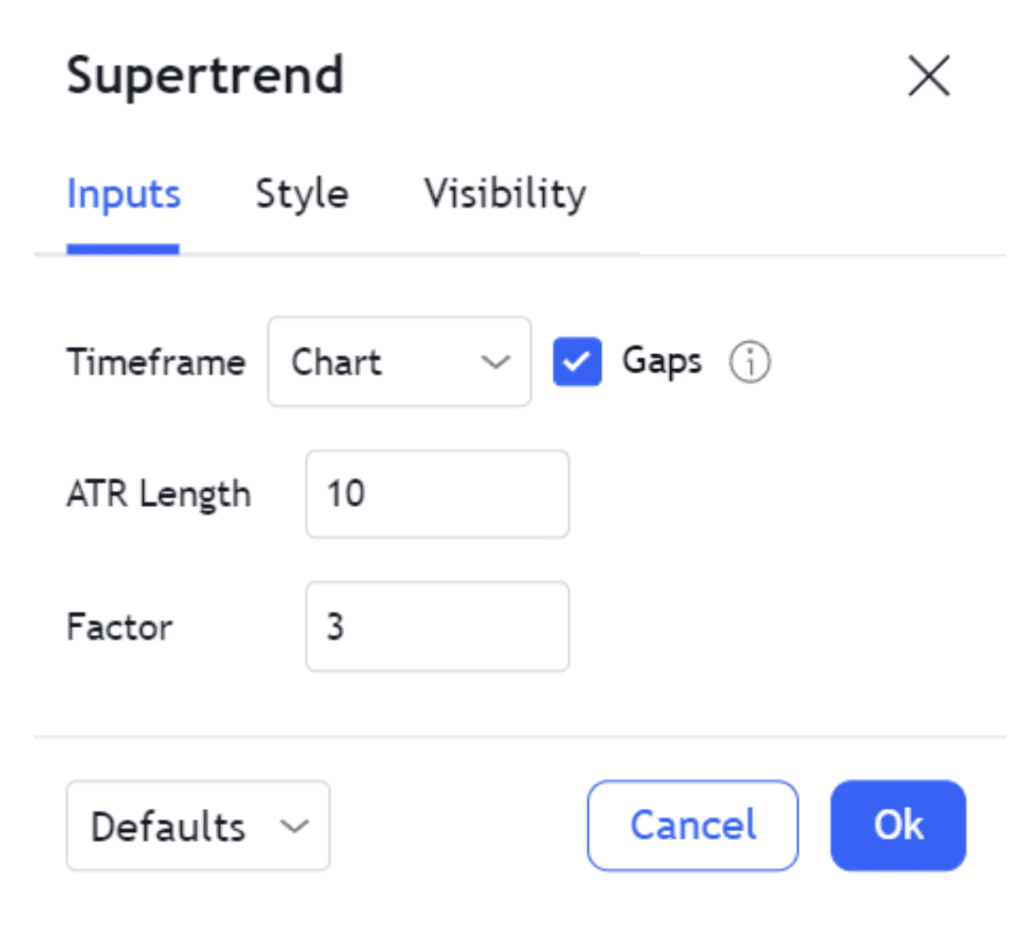
The timeframe refers to how the chart has been constructed. The price data could be shown for a few minutes for intraday charts. The equivalent ATR length based on the above default setting would be 10 minutes, and the factor or multiplier would be 3.
If the price is shown daily (as illustrated in the chart below), the ATR length would be ten days.
A trader must configure the chart settings and input the Average True Range and factor according to the trading strategy.
Using the Supertrend Indicator
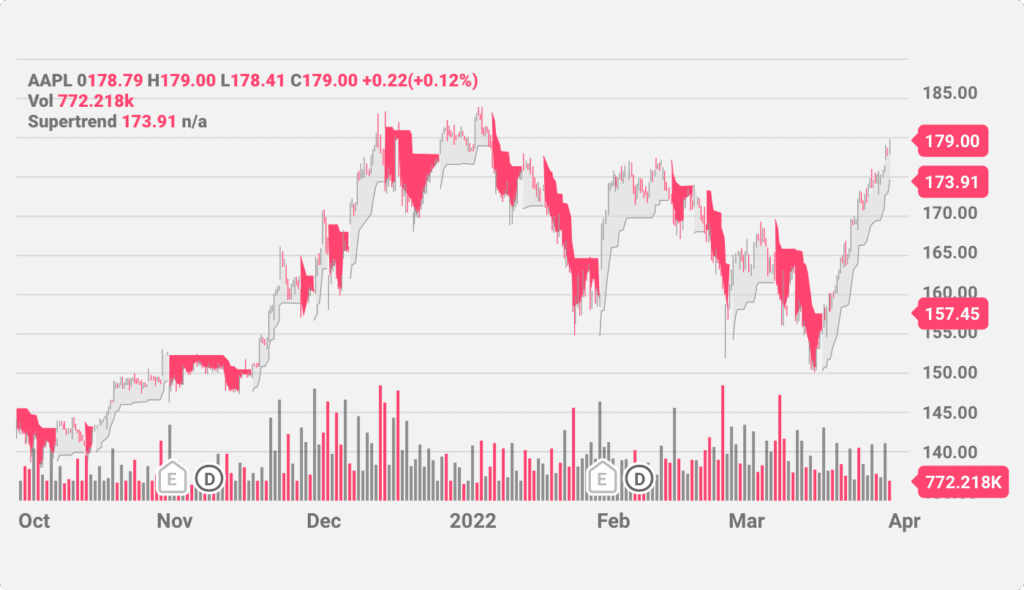
Once the Supertrend indicator calculation’s parameters are handled, the charts will display the Supertrend indicator as a line. The green line refers to the Upper Band, and the red line is the Lower Band. One can observe that these lines are not continuous, i.e., the Supertrend line is a combination of Upper and Lower bands. The Upper Band line is the Supertrend line below the candlesticks. Similarly, red lines form the Supertrend indicator above the candlesticks.
One can analyze how the Supertrend indicator changes color to determine whether there is a buying or a selling opportunity. There are several instances in the chart above where the line has given such signals. It is always good to add other technical indicators along with the Supertrend indicator to enhance its predictive power.
Supertrend Indicator Trading Strategies
A trader can look at the line and determine if the asset needs to be bought or sold. A green line allows buying, whereas a red line suggests selling. Looking at the chart above, we can see that when the Supertrend line shifts from red to green, there is a strong trend upwards. When the line turns red, the price drops.
You can use the Relative Strength Index as an additional tool to validate the signals from the Supertrend Indicator. Here is an example of the combination:
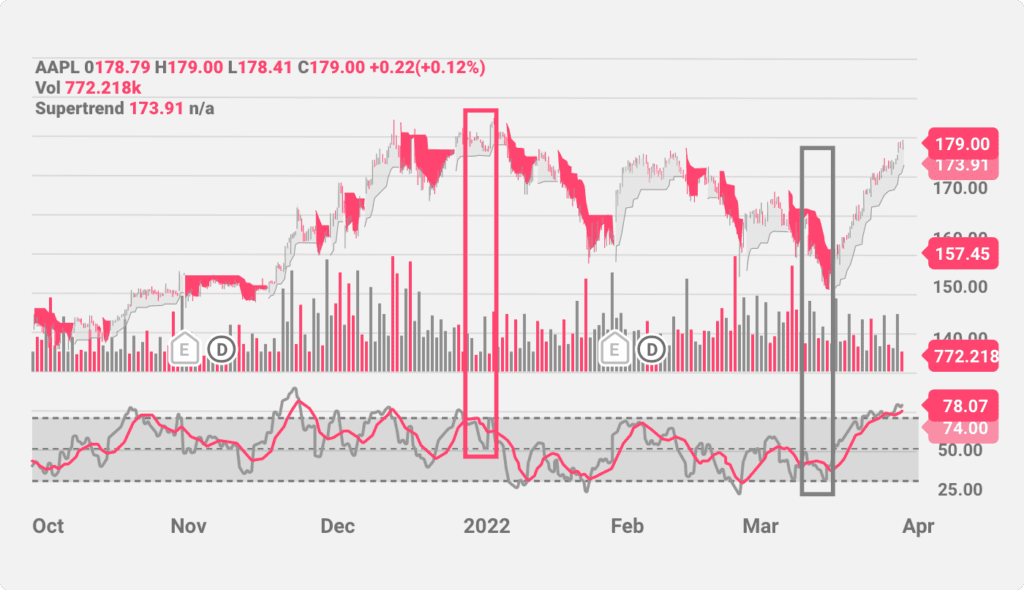
You can see two marked areas – one in red and the other in green. In the red area, you can see that the Supertrend turns red from green. The RSI is also above 74, another signal for a price drop. In the subsequent few sessions, we see that the price goes down. Similarly, in the green segment, the Supertrend turns green from red. The RSI is also close to 25, which is a clear buying signal.
The above is a simple illustration of how we can use other technical indicators along with the Supertrend line. There may likely be occasions during which signals from different indicators may contradict each other. It is advisable to use the indicator only when multiple indicators validate the same outcome. You can also use the Supertrend indicator to identify stop-loss levels. Along with the RSI, other technical indicators commonly used with the Supertrend are the EMA and MACD.
Advantages and Disadvantages of the Supertrend Indicator
Advantages of the Supertrend Indicator include:
- Easy to interpret: The calculation isn’t very complex even for beginners.
- The predictions are fairly accurate: This is especially true during trending markets where the Supertrend is among the most reliable indicators available.
- Easy to configure: Since the number of input variables is lower, it can be easily adjusted to meet the trader’s requirements.
- No cost involved: It is available on many free platforms, and additional software or add-ins are not required to implement the indicator.
- Highly responsive: It is quick to detect a change in trend, making it very handy for traders looking to exploit opportunities as soon as they arrive.
The common disadvantages of using it are:
- Not accurate during consolidation periods: When the market is trending sideways, the Supertrend line may generate false signals.
- The outcome may contradict other tools: It may yield contrasting results that may not help your trading decisions.
- May not work well with all assets: Traders must ensure that the indicator is reliable in the specific asset before using it. While the signal may be strong, it may not apply to all assets.