
There are many different strands of technical analysis. In its most basic form, technical analysis uses historical data to predict future market behavior. In many ways, this investment strategy is based on the concept that history repeats itself and does so in recognizable patterns. As we dig a little deeper, you will find that many people use different technical analysis types in tandem. Often they even combine it with fundamental analysis. While there is a skill to “reading technical analysis” in many ways, the main draw of this type of investing is that it takes away human emotion. As we know, fear and greed, two of the most powerful human emotions in the market. They can often interfere with investment decisions, and technical analysis is a method to keep them in check.

What is Technical Analysis?
If you ask 10 different people for the definition of technical analysis, you will no doubt receive an assortment of different answers. Even so, the core concept is simple; by analyzing historical data on a particular asset, you can identify real-time trends. In theory, there is no link between technical analysis and fundamental analysis, or is there?
Let us take a step back and look at any securities exchange. In its most pure form, it is a simple yet highly efficient marketplace for information. Different views and opinions are introduced via the investment decisions of multiple investors. The forces of supply and demand are what move prices based on a mix of public and non-public information. For example, those using technical analysis to look at trade volume will often see large spikes before important announcements.

History of Technical Analysis
Over the years, there has been a constant debate on technical analysis vs. fundamental analysis. Many traders have conflicting opinions on which one is the most productive. As we touched on above, the idea that technical analysis and fundamental analysis are two very different concepts may not be totally true. That said, history shows that there have been many prominent pioneers of technical analysis over the years.
Munehisa Homma
The Far East has been a treasure trove of information and investment strategies for hundreds of years. As far back as the 18th century, Japanese traders were using technical analysis to invest in different assets. One of the leading lights during this period was Munehisa Homma. Described as an “early behavioral economist,” he created what is now known as Sakata charts. Today these are perhaps best known as candlestick charts. The term “Sakata” relates to Munehisa Homma’s hometown, creating a lasting reference to his role in the world of technical analysis.
Charles Dow
Perhaps best known for creating the Dow Jones Industrial Index, Charles Dow created the foundations for modern-day technical analysis. Using historical data from the index, he would regularly write articles identifying the emergence of various trends. This is often referred to as the Dow Theory, an idea pioneered by William P. Hamilton.
William P. Hamilton
William P. Hamilton was a trailblazer who used the concept of the Dow Theory. He added new rules to create unnervingly accurate predictions. He was the first to identify the concept of the four-year long-term trend, incorporating short-term waves which could last days, weeks, or months. Many see William P. Hamilton as the forefather of technical analysis. While he was a little premature in predicting the 1929 crash, voicing concerns in 1927 and 1928, he made a final appeal to investors on 21 October 1929. This was just three days before the 1929 stock market crash. This preempted the great recession of the 1930s. While he passed away just weeks after the 1929 stock market crash, his legacy lives on today.
Robert Rhea
You will notice a common string among some of the early technical analysts – the Dow Theory. It is safe to say that Robert Rhea took the theory, enhanced it, and built a technical analysis business. Described as one of the first “market movers,” Robert Rhea made most of his wealth through his subscription investment letter, Dow Theory Comments. So, not only did we have a man who turned the world of technical analysis on its head, but he also introduced the first subscription investment newsletter!
Edson Gould
Arguably the most successful long-term technical analyst, Edson Gould made most of his wealth from subscription newsletters. Even back in the 1930s, these comments and analyses were in high demand. Records suggest that subscriptions for his investment newsletter were pegged at a staggering $500. He was a leader in the field of technical analysis, and many traders followed his example. He predicted a range of highs and lows for the Dow Jones Industrial Index over many years. When the DJIA was below 1000 points back in 1979, he successfully predicted that it would rise to more than 3000 by 1991, even considering the 1987 stock market crash.
John Magee
Even back in 1948, John Magee was rewriting technical analysis with his book “Technical Analysis of Stock Trends.” He was seen by many as the first person to trade solely on technical analysis. In effect, he was betting on history repeating itself, and he was able to identify numerous chart patterns. Triangles to flags, bodies to head and shoulders, the list began to grow. Rather bizarrely, despite his accurate predictions using technical analysis, he made many of his personal investment decisions on gut feeling. It was only from his 40s, up till his death in his 80s, that he found the discipline to invest in his own technical analysis signals. Unlike others who were happy to wax lyrical in newspaper columns, John Magee preferred to let his form of technical analysis speak for itself – unhindered by popular opinion.
There are many other prominent figures in the world of technical analysis going back hundreds of years. From the 1800s to the current day, the basic concept of technical analysis has remained steadfast. The use of historical data to predict future trends, identifying buy and sell signals, is even more powerful today than it was in the past. Huge computers can now analyze vast amounts of data and make trading decisions in a split second.
The Basics of Technical Analysis – The 3 Principles
The question “what is technical analysis” is best answered using the three basic principles. These principles are:
Markets discount everything
As we mentioned earlier, the best way to view a securities market is as an information exchange. It will reflect what public information and non-public information is available, which will, in turn, influence investment decisions. Consequently, on the basis that the price today reflects all information about that company, sector, economy, prospects, etc. The popular way to describe this phenomenon is to say these factors are “priced in.” In theory, price tells us everything we need to know. Therefore, monitoring the price and volume should give us an idea of future trends.
Market inertia
Swapping the term inertia for the word trends might make this concept more recognizable. There is an old saying among traders: “The trend is your friend,” whether it’s rising, falling, or trending sideways. Trends are likely to continue until they’re challenged by a “breakout” moment. This is especially important to traders. The ability to trade the trend and bail out when technical analysis suggests the trend is changing is enough for many traders to build a career on.
Markets move in waves
Whether looking at short, medium, or long-term trends, you will notice various instances of overbought and oversold markets. The analogy that markets move in waves is very apt. For example, if a company makes a major announcement, it may prompt buyers and sellers to emerge. It’s like how dropping a stone into a glass of water will prompt ripples until the water’s surface evens out and a “new balance” emerges. This is similar to technical/fundamental changes in asset prices.
The idea of using waves as an analogy for technical analysis is interesting. Traders seek to hop on the wave at the bottom, ride it to the crest and then jump off at the peak. Sounds like a surfer’s ideal world!
How Technical Analysis Can Help You Improve Your Trading
You will often hear people discussing the question of technical analysis vs. fundamental analysis. While nobody suggests that fundamental analysis does not have a place in investing, technical analysis is also critical for short to medium-term traders. However, how can technical analysis improve your general trading? Here are a few examples.
Understanding market movements
The ability to take a broader look at the overall picture of moving asset prices/indices is invaluable. Even during upwards trends, you will see periods of volatility, sometimes extreme volatility. These can still occur within the confines of a long-term uptrend and often present a buying/selling opportunity.
Discipline
It is all too easy to be influenced by human emotion, predominately fear and greed. They can cause you to waiver from your disciplined investment approach. While no investment strategies are set in stone, you need to have discipline. You need to be focused and deal in facts, not feelings.
Identifying trendlines
When looking at technical analysis, it is not difficult to look back in hindsight and spot an “obvious” trendline emerging. Identifying a relatively early stage trend is not easy, but it can be extremely lucrative when you spot them in time. The longer you wait for the trendline to emerge, the “safer” your investment, but this can potentially limit your profit. So, as with any type of investment, it is simply a case of balancing the risk/reward ratio for your particular scenario.
Flexible targets
When acquiring any asset or going short, it is important to be disciplined, but you should stay flexible. For example, increasing your stop-loss limit while a strong trend is in place makes perfect sense. However, once the asset hits your stop-loss limit, you need to be disciplined enough to let go.
Trading boxes
You might have heard the term “trading boxes” instead of trading stocks, shares, futures, and other assets. It simply means that you should see any asset as an “empty box” to which you have no ties and no emotional attachment. So, it is simply a case of buying the “box” at the bottom of the range and selling at the top. While easier said than done, this is a useful way of removing any emotional attachment or preferential treatment for a particular company/asset. We all have our favorites.
Patience
They say patience is a virtue. In the world of trading, it is an invaluable characteristic. We’ve all been there: you make a profit on a recent investment, and straight away, you’re looking for the next trade. Successful long-term investors would bide their time, not necessarily jump from one trade to another, taking profit when the time is right, and invest when they see a new trend emerging. As they say:
A fool and their money are easily parted”
There are many different things you can learn from technical analysis. The two most important are probably discipline and patience.
How to Learn Technical Analysis When Trading
When you start learning technical analysis, it is very tempting to jump in, lock stock and barrel. It looks easy, the signals are relatively straightforward, and you think the money will just roll in. If only it was as simple as that. It is essential to do your research before switching your trading strategy to one involving technical analysis. The information is in front of you, but you still need to read it and interpret it.
Learn the Key Concepts
The key to being successful using technical analysis, is to research and learn the main concepts. These include the ones mentioned earlier:
- The market is a highly efficient information exchange
- Market inertia leads to price trends
- History repeats itself time and time again
These are the three main concepts to take into consideration when looking at technical analysis. While some investors will make money “going against the market,” the market is extremely capable of pricing in events both expected and unexpected. If an investment looks too good to be true, it probably is!
There are numerous different types of indicators when it comes to technical analysis:
- Price trends
- Chart patterns
- Volume indicators
- Momentum indicators
- Oscillators
- Support levels
- Resistance levels
- Moving averages
Once you begin to understand the concept of technical analysis and familiarize yourself with the various indicators, they can become potent investment tools.
Learn How to Analyze Charts
The first thing to remember is that technical analysis and the analysis of charts are not exact science. There is a degree of human interpretation which can influence any action taken. It is worth noting that the more price points on a chart you can involve in a trendline, the stronger the signal. We have included several charts below to give examples of ways to analyze and use chart data for building your investment strategy.
Chart 1
As you can see from the chart below, there are three distinct lines of support and resistance. Initially, there is a period of sideways trending between the green line and the blue line. When the index falls below the green trendline, it prompts a significant sell-off. On the upside, a later breakthrough in the green trendline prompts a powerful rally that gets temporarily disrupted by the blue line, which became a line of resistance. Then we see another bout of sideways trading between the blue line and the orange line, with one major dip below the blue line. This dip is later confirmed to be a “false flag.” Once the index broke through the orange line, we can see another strong rally into new uncharted territory. A trader’s dream!
It is easy to see how different investors may interpret different trendlines as either support or resistance. In reality, a support line can very quickly become a resistance line and vice versa.
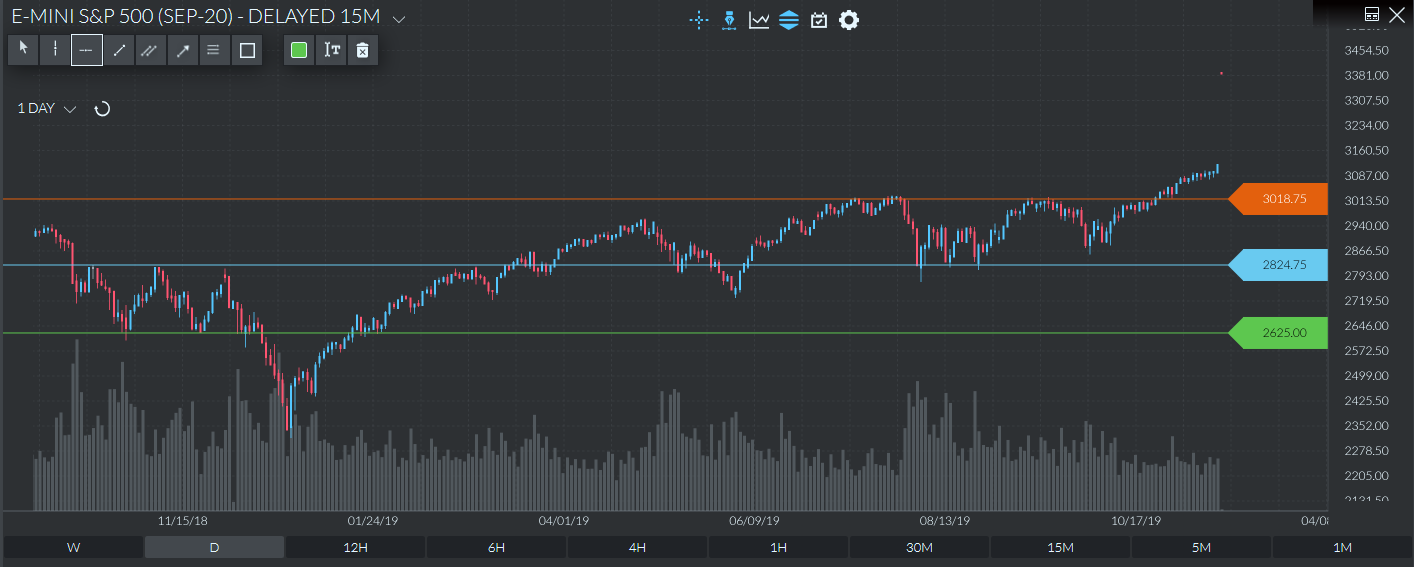
Chart 2
This is a fascinating chart because you can see two sets of support/resistance lines. This highlights a narrow range of activity while the index is still in a long-term uptrend. You will see that after the initial rally, the higher line becomes a support line for the first stage of the uptrend. Once the index falls through the support line, this prompts another fairly narrow range of activity while still maintaining the long-term uptrend. However, when the index falls through the lower support line, the long-term uptrend is broken, and there is a subsequent fall in the value of the index.
It’s not difficult to see the fairly strong sell signal as the index falls below the lower support line.

Chart 3
This chart is another example of an uptrend with a very distinct upper resistance line and a lower support line. It creates a relatively narrow corridor of activity with the index bouncing off upper resistance and rebounding from the lower support level. Interestingly, the index appears to hang on to the lower support level as long as possible before a significant sell-off. It is most likely that the last few days before the sell-off would have seen a reduction in momentum, identified using other technical analysis forms, thereby prompting concerns about a break downwards.
Using one form of technical analysis, it looks as though the index is holding on to the lower support level for dear life. When incorporating additional momentum analytics this would likely show a weakening of the uptrend and prompt concerns about a downturn – before it occurred.
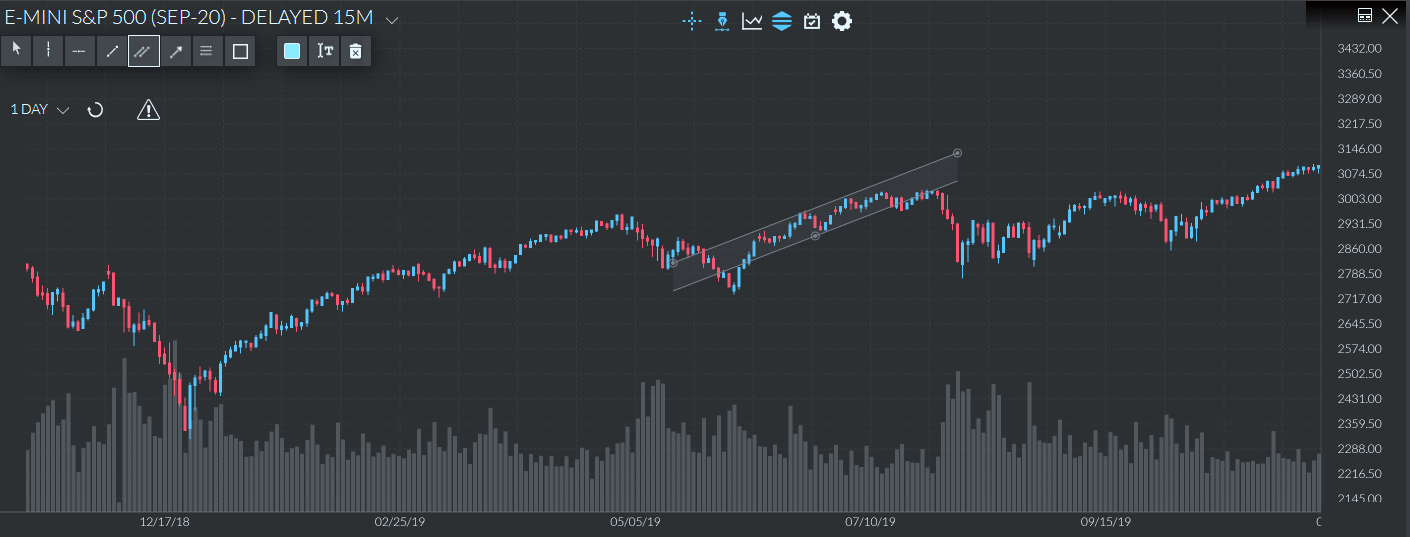
Chart 4
Those who suggest that chart analysis is easy in hindsight often misunderstand the fundamentals of this form of technical analysis. As you can see from the chart below, there is evidence of a medium-term uptrend creating a relatively tight upward trading range. As the corridor narrows, this creates a classic chart pattern indicating a breakout on the upside or the downside. In this case, there was a strong sell signal ahead of a fairly abrupt sell-off. This type of signal would be useful for those looking to profit on their long positions or those looking to take a short position to take advantage of an emerging downtrend.
As the trading window narrows while maintaining the uptrend, this is a signal that a significant breakout is on the horizon. It would also be possible to draw in trendlines after the initial sell-off between 2811.25 and 2638.25, taking in some market fluctuations. Then we have a break below 2638.25 and another significant sell-off.
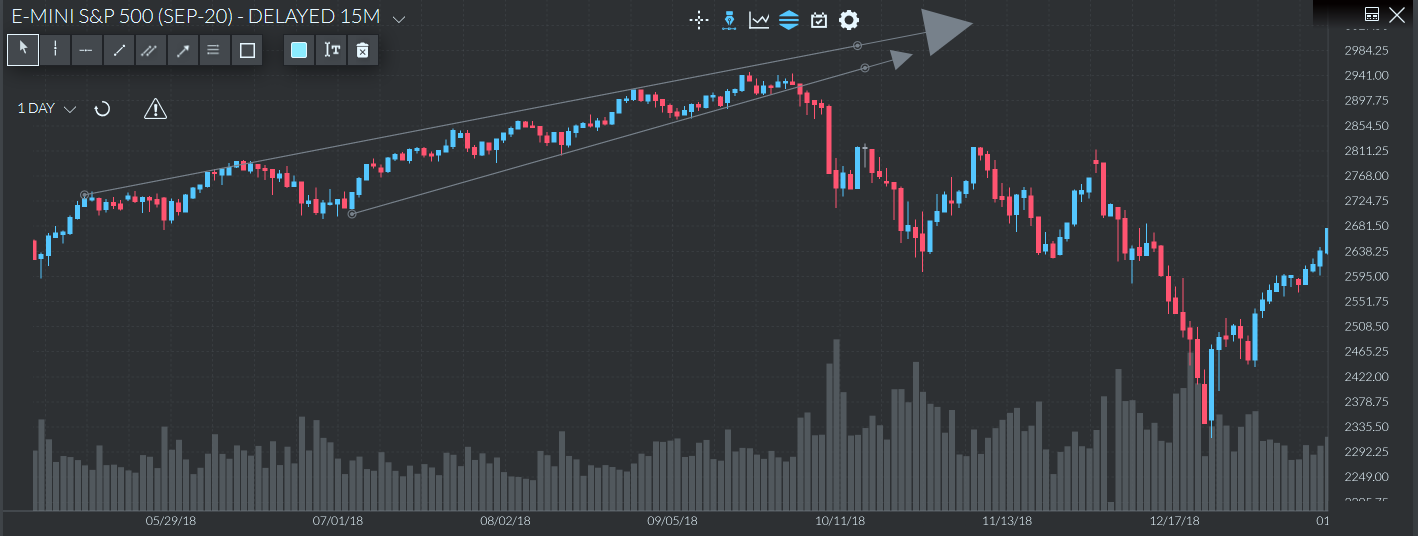
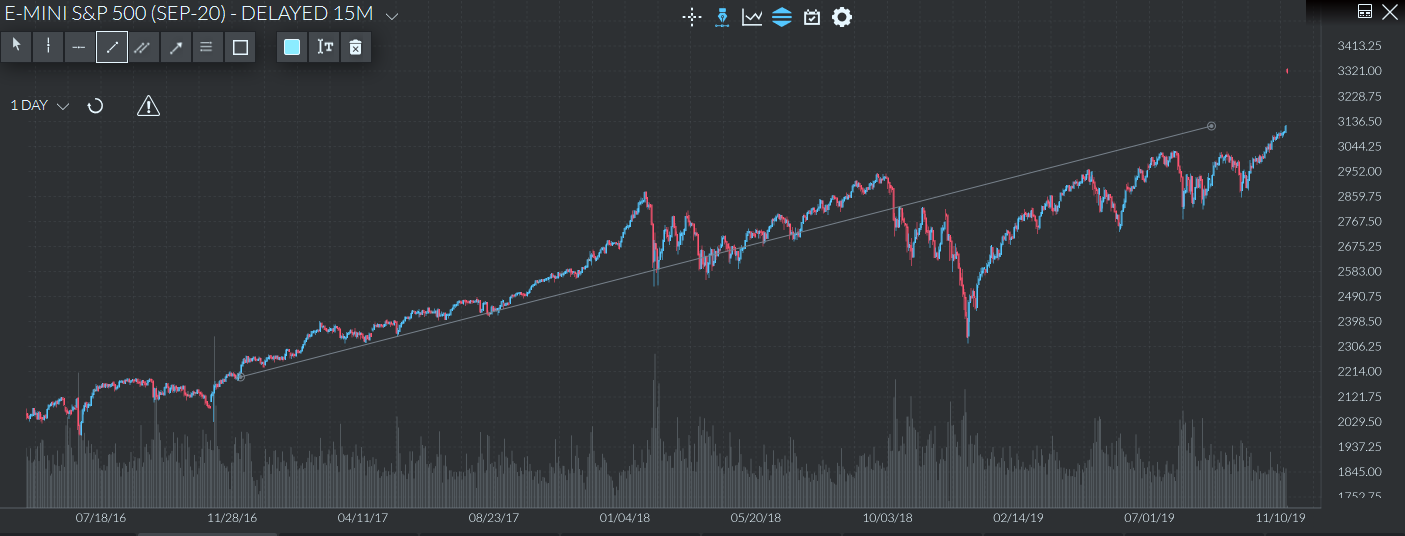
Chart 5
This exciting chart shows a long-term uptrend in the index from as far back as November 2016 until October 2018. This long-term trend incorporates many relatively short-term trends, such as the significant rise and fall in early 2018. You can also see several potential false flags where the index dipped below the long-term trendline but recovered. It would be easy to assess this as a downward move in the heat of the moment. If you act on impulse and close any long positions, you’re potentially missing out on an additional 200 plus rise in the index. In hindsight, it would be easy to recognize that as a false flag. Again, this is where the use of multiple technical analysis strategies comes into play.
Many people automatically assume that those looking for short-term trading opportunities ignore long-term trends. This is not correct. As you can see from the chart below, while there were opportunities to trade on the upside and the downside while the uptrend remained intact, the eventual sell-off was fairly abrupt. So, the key is to maintain focus on your investment strategy. Short-term traders look for short-term price movements while also remaining vigilant of a change in long-term trends.
Use Of Indicators
There are many different indicators used in technical analysis. The two main areas of interest are price movements and trading volumes. While trading volumes are sometimes overlooked, a significant surge in volume can often preempt the market’s top or bottom. When trading company shares, an increase in trading volume can often preempt a significant announcement from the company. Some companies are leakier than a sieve!
Next, we’ll list 10 popular indicators used in technical analytics. These are all fairly useful in and by themselves. However, using two or more together can potentially create stronger signals.
Stochastic Oscillator
The Stochastic Oscillator compares and contrasts the current price against the recent price range. This helps identify potentially overbought/oversold markets.
Bollinger Bands
The basic concept behind Bollinger Bands is that overstretched price fluctuations will bounce back like an elastic band. Using moving averages, this indicator uses volatility as a method of identifying changing trends.
Moving Average Convergence Divergence Indicator (MACD)
The MACD is a versatile tool that shows the relationship between two moving average indicators to identify new trends.
Relative Strength Index (RSI)
The RSI is a useful method of identifying overbought/oversold situations using relative strength compared to recent price activity. Very influential!
Fibonacci Retracement
Often used by short-term traders, such as those investing in index/currency futures, the Fibonacci Retracement theory dates back to an Italian mathematician in the 13th century. The use of strictly defined Fibonacci ratios creates an array of support/resistance lines – perfect for swing trades.
Money Flow Index (MFI)
The Money Flow Index offers a means of measuring spikes in trading volumes, indicating a change in trend or imminent news.
Parabolic Stop and Reverse
This indicator is a useful means of identifying potential reversals in an index/stock price direction.
Simple Moving Average (SMA)
The SMA trendline is used to flatten out short-term fluctuations in an index/asset price, to highlight the underlying trend.
Aroon Indicator
The Aroon indicator incorporates two specific components – “Aroon Up” and “Aroon Down” – highlighting range-bound behavior and changing trend patterns.
Ichimoku Cloud
The Ichimoku Cloud measure is a relatively new indicator that is growing in popularity. It is a useful means of measuring price momentum with a deliberate lag to reduce false flags.
Try Mixing Two Indicators or More
When we strip technical analysis down to the bare bones, it comes down to trends, short-term, medium-term, and long-term trends. You will find that no two technical analysis indicators will give exactly the same signal simultaneously. Using one type of technical analysis in isolation can create false flags, prompting you to react too early. The use of two or more types of technical analysis will reduce the influence of false flags. However, there is a downside to using two or more technical indicators.
If you were to spot a change in trend using one relatively short-term technical indicator, there might be the chance to buy into this new trend at a relatively early stage. Those who depend on two or more technical indicators to turn positive before investing would likely hold back. On the plus side, the more technical indicators turning positive, the stronger the signal – the trend is changing. On the downside, a lag on, for example, a moving average technical indicator can mean you join the party at a later stage. It is important not to use too many technical indicators at the same time. This overcomplicates the situation and could seriously delay any investment decisions.
Combine Technical Analysis With Fundamental Analysis
Many investors will have heard the term “the trend is your friend,” which is very simple but very apt. To the naked eye, asset price movements may seem relatively random and often volatile, but there is a method to the apparent madness. Stock markets react to supply and demand in their most basic form. There is an argument to suggest that fundamental analysis is already incorporated into stock prices – using both public and non-public information. However, for those who perhaps have a longer-term investment outlook, the integration of fundamental analysis and technical analysis can be useful.
Advantages and Disadvantages of Using Technical Analysis
As with any investment strategy, there are numerous advantages and disadvantages to using technical analysis. No investment strategy is an exact science, and there are many different factors to take into consideration.
Advantages of using technical analysis
The main advantages of using technical analysis include:-
- Very useful at predicting ongoing and future trends
- It helps to identify entry and exit points
- Early signals can be high risk but indicative of a change in trend
- Quicker and cheaper than fundamental analysis
- Short, medium, and long-term trendlines provide vital data
To get the best out of the technical analysis, you need to fully buy into the concept, learn to read charts, and spot emerging trends. Discipline and focus are essential.
Disadvantages of using technical analysis
The main disadvantages of using technical analysis include:
- How investors use chart data is down to individual interpretation, it’s not an exact science
- Different indicators can show different signals at the same time
- Long term trend indicators can significantly lag behind short-term trend changes
- Short-term technical analysis indicators can lead to false flags
- The manual introduction of chart trendlines can lead to inaccuracies
Using one type of technical analysis can lead to very different results. A false flag could prompt a loss-making investment decision. A correct early trend change indicator could lead to early and potentially profitable investments. This is why many people tend to incorporate at least two different technical analysis methods into their investment decision-making process – balancing the pros and cons.
How is Technical Analysis Different From Fundamental Analysis
Fundamental analysis of an investment, for example, a technology company, will depend solely on the information made public by the company and analysts. There will always be things going on “behind-the-scenes,” which may impact the share price but are not public knowledge. Consequently, the announcement of quarterly, interim, and full-year results is often discounted in favor of accompanying statements offering future guidance. Note, reports, and accounts reflect a specific point in time and can be manipulated to give the best possble impression at that time.
If we return to the subject of highly efficient markets, highly efficient information exchanges, there is an argument to suggest that this already incorporates fundamental analysis. If we look at index futures, the index level you see before you will incorporate the current situation and expectations for the future. For example, how are interest rates expected to move in the short term? Is there political stability that business sectors can rely on, or are there tough recessionary times around the corner?
Investors should also be ready for the unexpected, such as sudden interest rate movements, international trade disagreements, disappointing economic figures, and below estimate company results. Even though markets can’t incorporate these unexpected issues, they will quickly react and find the “right level.”
Risks of Relying Solely on Technical Analysis
While many investors make a very lucrative living out of short-term trades based solely on technical analysis, this is not without risk. These risks include:
Interpretation bias
Even if the same information is available to all investors using technical analysis, there can be a degree of interpretation bias. If you are bullish on a particular index, then you may see a short-term push through a resistance line as the creation of a new trend. It is dangerous to react to one push above or below a trendline since it can reverse fairly quickly.
Favouring one style of technical analysis
As we touched on above, many people tend to use many different technical analysis types before making any fundamental changes to their investment portfolio. They may incorporate short, medium, and long-term indicators to back up any change in trends. Some investors “see what they want to see” and will focus on one aspect of technical analysis, which gives the results they seek for their preconceived ideas.
Lack of fundamental appreciation
If you rely solely on technical analysis without any appreciation of fundamentals, whether for an index, stock, or type of commodity, this can create risks. You don’t necessarily have to trade on fundamentals, but it is best to appreciate which fundamentals move a particular index or type of investment.
Appreciation of short, medium and long-term trends
When you look at technical analysis, you will find it possible to have different short and long-term trends. Some traders will invest in short-term index movements, while others will take a more long-term approach and ride the “short-term volatility.” However, it is useful to appreciate an intact long-term and medium-term trend even if trading on a relatively short-term basis.
Does Technical Analysis Really Work?
The question of whether technical analysis really works depends upon your view of this art form. There are huge diverging opinions on this subject covering both ends of the spectrum. In reality, if you don’t believe in technical analysis and don’t fully commit yourself, then it won’t work for you. If you use technical analysis in its many forms and stay disciplined and focused, then there is every chance it will work for you. It is also worth noting there are numerous different types of technical analysis methods. Moving averages, candlesticks, volume, and many others are available to all investors.
As an investor, we all have a tendency to overreact to both the ups and the downs. Akin to rough seas, this creates peaks and troughs around the central trend. Eventually, the peaks and troughs will flatten, and the asset price will find the “correct level.” Don’t forget that stock markets and other securities exchanges are extremely robust —the prices you see before you often incorporate both public information and insider information. More information than the average investor will be aware of at any time.
Final Thoughts
So what is technical analysis? The concept of technical analysis has been around since the 1800s, if not before. It is based upon the concept that historical price movements will repeat themselves time and time again. It is, therefore, possible to extrapolate current emerging trends from historical price movements. Even though some people may disagree that history repeats itself concerning index movements, we know that investor behavior is fairly predictable. The big question, is it the trend that dictates investor action, or is it investor action that dictates the trend? Similar to the chicken and egg question, which came first?
Whether or not you believe that technical analysis is, in fact, a self-fulfilling prophecy, it works, and there are many examples of it in action. We all have the same information before us but learning how to read, understand and predict future price movements is an art form.