
Technical analysis is an excellent way to assess the price of a stock and estimate its future trajectory. While it is based on historical data, analyzing price movements can be a very dynamic process and has been studied extensively in the use of investing. Technical indicators generally complement fundamental analysis.
The latter focuses more on the financial position of a firm along with prevailing economic conditions. Technical indicators see extensive use in equity and forex markets. They help study how price movements in the past emulate the future. There has also been an increase in the complexity of new indicators. With additional computing capabilities, indicators are now able to track price movements down to the second. Doing so enables traders to act faster and more efficiently.

What is a technical indicator?
A technical indicator is a mathematical approach to understanding how the price of an asset might move. The inputs include historical price, volume, or open interest in the case of derivatives. The indicator is generally plotted over a chart and the trend is used by traders to estimate how price could behave in the future. As a trader you can customize most of these indicators according to your personal needs.
While these indicators offer a simple way of identifying trends, you’ll need test them first to assess their capabilities. This is particularly important since many existing indicators keep getting constant updates. Traders also create new ones every day. One way to check the accuracy is by back testing. This is a process in which you compare the actual results to what the indicator itself predicts. If both the results are in tandem, then the indicator may be considered effective. If that’s the case, it could be useful for making investment decisions.
You might also enjoy:
Types of technical indicators
Indicators can be classified in several ways based on whether they are tracking price or other metrics. Generally speaking, you can sort them into the following four categories:
Trend Indicators
This shows whether there is a trend in the price of an asset. It helps traders understand if the signal is strong or whether they’re seeing a possible price reversal. The Moving Average Indicator (MA) is the most popular trend indicator.
Momentum Indicators
A more advanced form of a trend indicator, momentum indicators help to quantify the strength of a trend. It helps determine whether an asset is overbought or oversold. The Relative Strength Index (RSI) and Moving Average Convergence/Divergence (MACD) are the two popular momentum indicators.
Volume Indicators
Volume indicators use the volume of trades, how frequently these assets are bought or sold. Often complimented with trend/momentum indicators, they help to substantiate the results from the other indicators. The Volume Oscillator is an example of a volume indicator.
Volatility Indicators
Volatility measures the deviation of price from its average. Higher volatility indicates that price has been fluctuating a lot and you can expect it to settle down in the future. In particular, the Bollinger Bands indicator is one of the most common and widely used volatility indicators.
Some commonly used technical indicators
While there is a wide array of technical indicators that can be used, we have listed a few that are commonly used and can be easily understood.
Moving Average Indicator
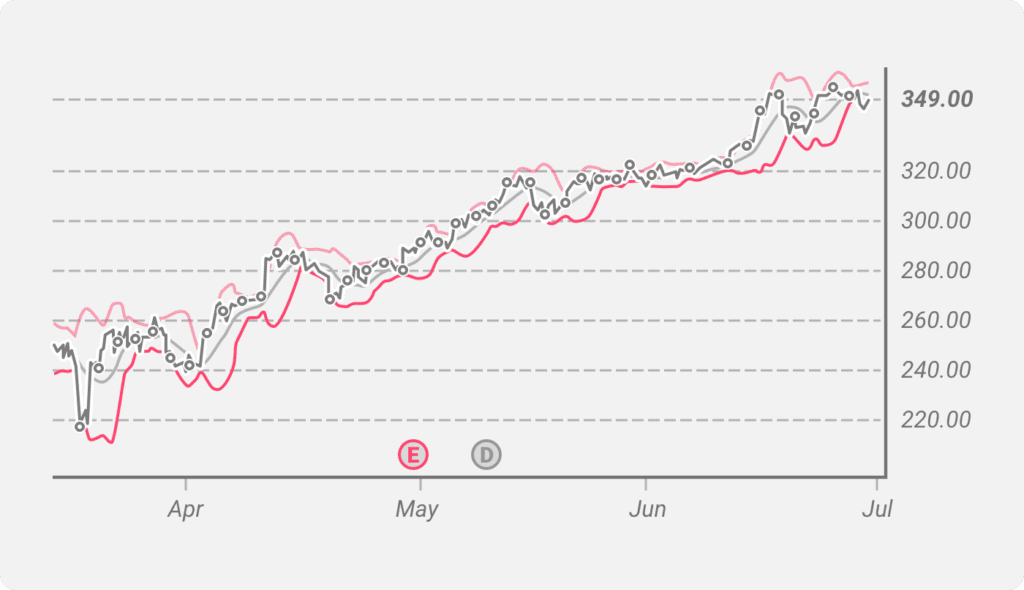
It is a trend indicator and is one of the most widely used technical indicators. It plots the price of a share along with the average price over a certain period. The average price can be for a few days or you can customize it and reduce it to even just a few minutes. The chart below shows the 14-period (day) weighted moving average plotted against the price of the S&P 500 E-Mini.
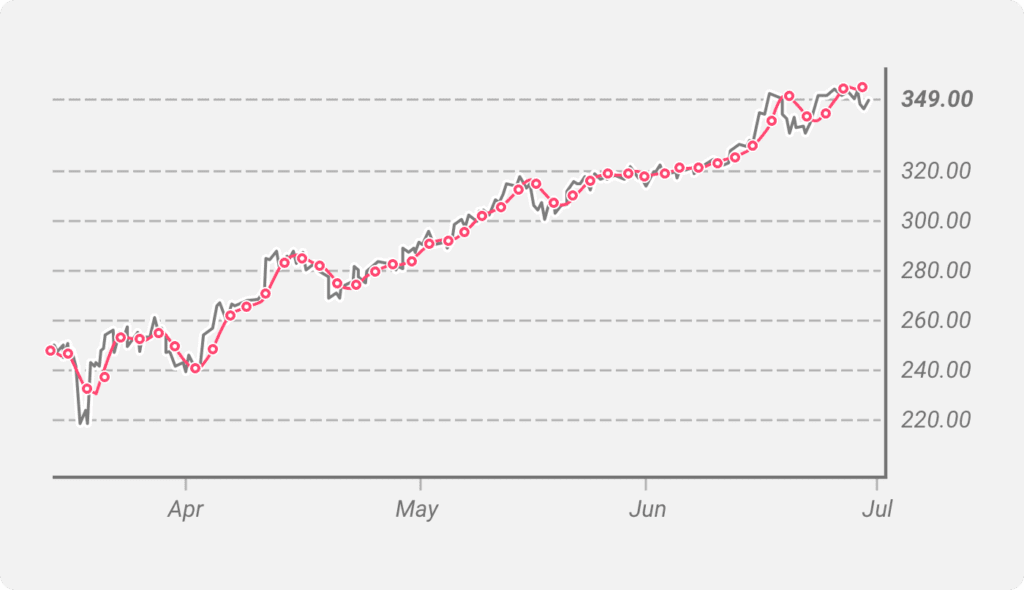
As you can see on the chart, on many of the occasions when the price line has crosses over the moving average line, it results in a trend reversal. This is also referred to as a crossover. As a trader you can customize the indicator’s time span depending on whether your interest is trading short-term or long.
Moving Average Indicators are also used to determine the resistance or support point. In an uptrend, a 50-day MA, 100-day MA, or 200-day MA can be used to determine the support level. You can make similar observations for resistance levels in a downtrend. MA indicators are lagging in nature, since they depend on historical prices.
The Exponential Moving Average Indicator depicted in the image is an advanced version of MA. It puts more weight on recent prices when calculating the average. This helps to account for the most recent price thereby reducing the lag that we generally observe in Simple Moving Averages.
Relative Strength Indicator
The RSI is a common momentum indicator ranging between 0 and 100. A value above 70 suggests that the share is overbought and there could be selling pressure in the future. An RSI of below 30 indicates it’s oversold and that there could be an increase in price in days to come. The mathematical formula for RSI is:
RSI = 100 – 100 / (1 + RS)
RS stands for Relative Strength. It measures the average return of the up-move divided by the average returns of the down-move. In a 15-day RSI, if there are 10 days of gain with an average gain of 0.5% and 5 days of loss with an average loss of 0.25%, then RS is 2 and RSI is 67%.
The chart below shows the classic 14-day RSI for the S&P 500 E-Mini.
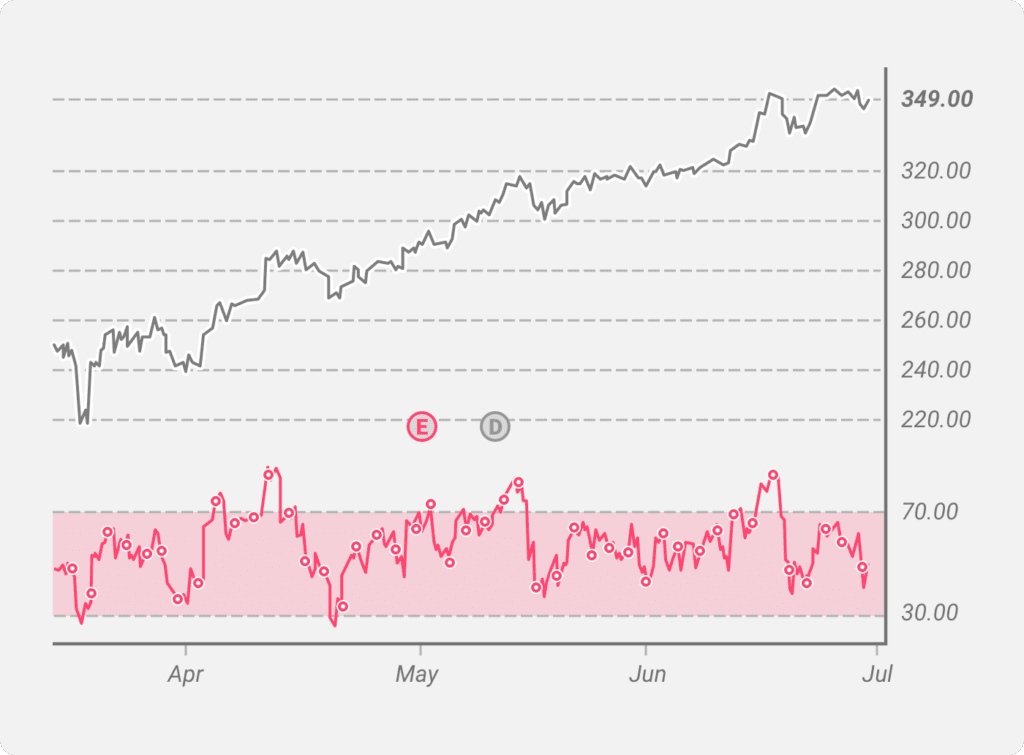
Unlike MA indicators, you need to plot the RSI in a different section since the scales are different from that of price. The two dotted lines represent overbought and oversold levels. In numerous instances price fell every time the RSI breaches a value of 70. You can also reduce the time frame to a few seconds instead of 14 days for more dynamic trading. Traders also change the overbought level to 90 and oversold levels to 10 to gain more confidence in the results.
Volume Oscillator
Price indicators may sometimes produce results that don’t necessarily reflect the real picture. In periods of consolidation when prices are relatively flat, price indicators may not be reliable. Similarly, when there’s no heavy volume to back up the price fluctuation, the changes in price may not be sustainable. Volume indicators give credibility to the results obtained from other indicators.
The Volume Oscillator is one such indicator. Here’s how you calculate it:
Volume Oscillator = [(Simple Average of Volume Traded for Shorter Period – Simple Average of Volume Traded for Longer Period) / Simple Average of Volume Traded for Longer Period] * 100
The chart below shows the Volume Oscillator where the longer period is 10 days while the shorter period is 5 days.
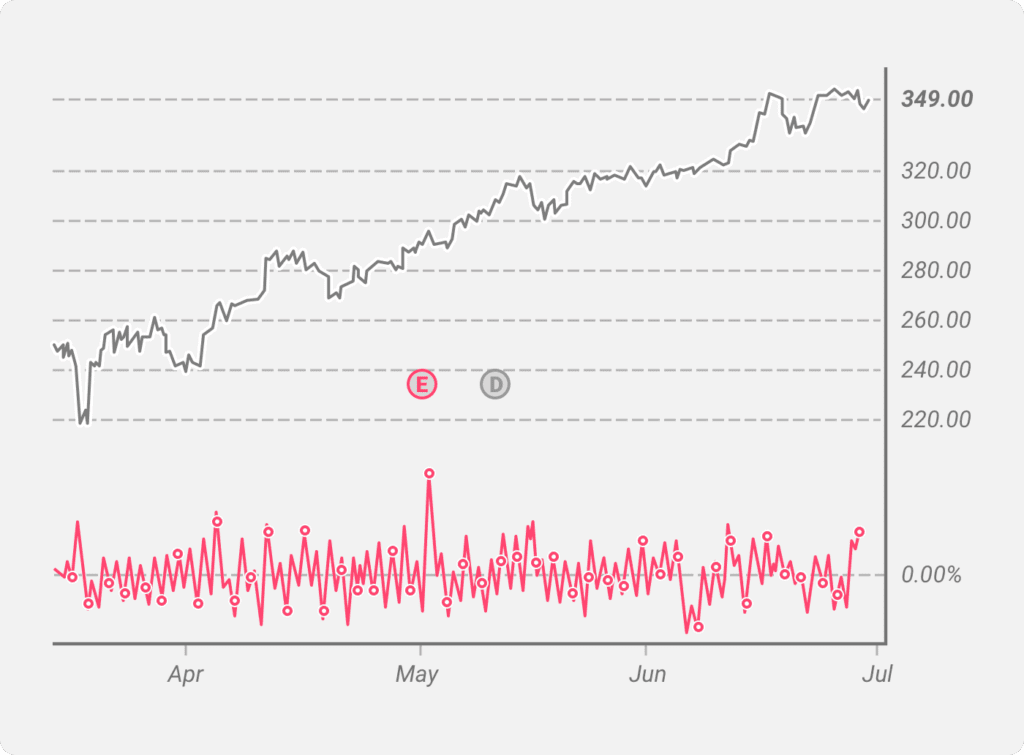
In the above chart, we don’t see a distinct pattern to suggest that the volume oscillator could substantiate the the uptrend we can observe. This would have been conclusive if the oscillator points were consistently above 0%. Nonetheless, you can’t write off the indicator. It is best to use it along with other technical indicators.
Bollinger Bands
It is a type of volatility indicator which uses the Simple Moving average and volatility as inputs. The following three lines make up the band: an n-period Simple Moving Average line, an upper Bollinger Line, and a lower Bollinger Line. The upper line is generally two standard deviations above the Simple Moving Average while the lower line is two standard deviations below. Standard deviation is a measure of volatility. Therefore we can consider Bollinger bands volatility indicators.
Upper Bollinger Line = Simple Moving Average + number of standard deviations * volatility
Lower Bollinger Line = Simple Moving Average – number of standard deviations * volatility
As the lines come closer, it means that there has been a reduction in volatility. Prices close to the lower Bollinger band could signal an oversold situation signaling traders to buy. Many experienced traders recommend that you analyze trends while studying the patterns of Bollinger Bands.
There are other technical indicators like Moving Average Convergence/Divergence that provide useful insights but maybe a bit complicated to understand. Hence, beginners should first get a grasp of the basic ones and try to apply these in real scenarios. Users can open a virtual account to put their knowledge to the test for example. Many retail brokers will provide these accounts without any additional charge.
Conclusion
As trading systems evolve, trading indicators have been relied on to provide signals that are more dynamic in nature. Traders are now looking at parameters that can provide information every second. Even long-term investors who rely on fundamental analysis look at technical indicators to gauge the market sentiment. Indicators have become complex, and we advise traders to exercise judgment and not rely solely on a single indicator.