In this article we explained the role of the gold standard in the middle of the 1900s, up to its demise in the early 1970s, and today we will cover the price of gold since that time, and highlight the important moments which caused the price changes.
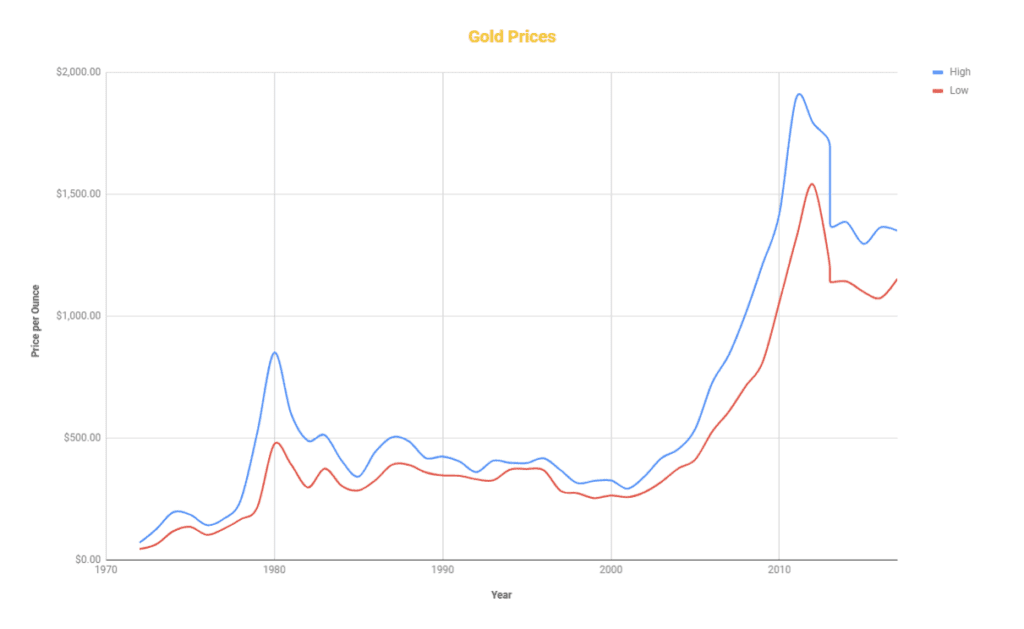
The obvious place to begin is 1971, when America began to remove the gold standard. First take a look at this graph of the highs (the blue line) and lows (the red line) of price over the years since the abolishment of gold standard.
Below we will break down the price movements by decade and some of the notable events involved. Under the heading for each decade we show the figures by year, with the maximum and minimums for the high and low categories for that decade shown with two stars and one star, respectively. These figures vary somewhat depending on the source of data since there is no universal exchange.

An overview of gold prices in the ’70s
1972: $44–70* 1973: $64-126 1974: $177-195 1975: $135-185
1976: $102-142 1977: $127-168 1978: $165-243 1979: $216-524**
As stated, the gold standard began to be dismantled in the early 1970s. The convertibility of the dollar to gold was ended in August 1971. Near the end of that year, the Smithsonian agreement moved the price of gold to $38 USD per ounce. The value of gold was changed to $42.22 in 1973 (though with convertibility gone this was just a benchmark rate).
It should come as no surprise that after convertibility ended, the price of gold increased. America already knew this was the way the price of gold needed to go. As you can see in the chart, the price had increased immediately prior to the end of the gold standard. Once gold was open to the pricing of the market, prices shot up. President Ford also changed the rules to allow private ownership of gold. Many heard this announcement as the shot of a starting pistol, and gold took off.
Take a look at the price just after the end of convertibility, in 1973-74. The price jumped to around 4 times higher, which was likely partly due to a bubble forming out of this newly exciting asset. The price seen in 1974 set a high point for most of the 1970s. Inflation was also higher than normal in this decade, which we will expand upon soon.
The price was seen breaking higher limits late in the 1970s. Starting in 1978, gold prices started a meteoric breakout. The low point in 1978 was roughly equal to the high point in 1977. This same pattern was seen the year after in 1979 as well, with the high price in 1979 reaching $524, roughly doubling the previous year’s high.
To say this was substantial would be an understatement. This was a new turn in history, and a big moment for the price of gold. There are a few reasons that explain this breakout. A large part of the explanation comes from the economic aims America pursued after World War II. The Employment Act of 1946 legislated the bulk of these aims. The website Federal Reserve History explains that this act made it the federal government’s responsibility: “to promote maximum employment, production, and purchasing power”.
These policy aims ended up causing high inflation as a byproduct. The dollar was pushed further towards inflation because of the Vietnam War and rising oil prices, as well.
In other words, money was losing value year over year, and this was at a rate that was historically quite high. Inflation rates reached 9% in 1978 and 13% for 1979. For context, there have been ten times after the Great Depression that year-over-year inflation was above 8%. Four of those instances are in the 1970s, with two others being 1980-81.
This is relevant because gold is a famous store of value. It is a real commodity that is easy to store, and will not lose its value easily.
That aspect of gold in and of itself makes it a better hedge of inflation. As people buy gold as a safe haven during inflationary periods, that drives up the value of gold. This therefore promotes gold as an investment as well. The cascade may even happen to the point of becoming a bubble, driven by these twin factors of inflation hedge and resultant speculation.
An overview of gold prices in the ’80s
1980: $474–850** 1981: $391-599 1982: $296-488 1983: $374-511 1984: $303-406
1985: $284–340* 1986: $326-442 1987: $390-502 1988: $389-485 1989: $358-417
The start of the 1980s was a historic time for gold. It hit a record high of $850 in January 1980, which was an unprecedented price. It was an even more dramatic price level because if you adjust it to modern prices, the price is $2200-2550, meaning this was the highest price of gold ever seen.
To some degree, it parallels the patterns seen in 1973-74. There was a very high inflation level of 12.5% in 1980 and 8.5% in 1981. As stated previously, inflation encourages people to invest in gold, with the possibility of forming a bubble. This event is a textbook example of this. Rising oil prices had a part to play in the enormous inflation, since oil is one of the biggest industrial inputs.
There were global political pressures that affected gold. The invasion of Afghanistan by the Soviet Union occurred at this time. Included in this was the Iranian revolution, where Mohammad Reza Shah Pahlavi was ousted aggressively. The Shah had the support of America at the time of the revolution, and the ousting marked the end of over two thousand years of Persian rule.
Since the overthrow was partly backed by leftists, worries increased about communism and its effect on gold prices. Communist societies obviously favor trade far less than capitalist ones. They typically have a similar approach to property rights for that matter. Possibly the most important factor here is that communism appeared to be strongly on the rise. This was yet another reason for western investors to get their hands on gold before it became more difficult to do so.
Just after the beginning of the 1980s, inflation became the biggest enemy of the US government. They enacted powerful policies to combat this problem. The main change in the economy was that of higher interest rates. Rates were raised multiple times by Fed chairman Paul Volcker. In the first three years of the 1980s, rates were above 10%, and about half of that time they were over 15%. These rates were sky high by historical standards. These rates did combat inflation as they intended.
There is more to this story. Recessions in the early 1980s were linked to the rate hikes as well as to the high oil prices. Eventually, around late 1982, the economy began to recover and interest rates were reduced somewhat. For the remainder of the 1980s interest rates swayed between 6 and 12%.
The higher interest and the reduced inflation rates had a stabilizing effect on the price of gold. Gold was no longer needed as a hedge for inflation, and suddenly there were many more opportunities to earn on investments. The amount of money some families had free for investment diminished as well, since mortgage rates were much more expensive during this time.
Gold prices found a low in 1985 after the highs of the early eighties, though they were not drastically lower. For the rest of the 1980s, gold prices fluctuated between $300 and $500. Obviously, the drop was hard on investors who bought at the price highs of 1980. A common insight which comes through from the early 1980s: asset bubbles are dangerous and easy to get swept up in. To be fair, they are easier to see in hindsight.
An overview of gold prices in the ’90s
1990: $345-423** 1991: $344-403 1992: $330-359 1993: $326-406 1994: $369-397
1995: $372**-396 1996: $367-416 1997: $283-367 1998: $273-314* 1999: $252*-323
The 1990s were much calmer compared to the previous two stormy decades. The 90s began with a recession starting in mid-1990 and ended in March 1991. This recession was not particularly powerful as far as recessions go.
The Federal Reserve was again trying to combat inflation with restrictive monetary policy. In other words, there was less money circulating at this time in the US, which resulted in a suppressed economy. The recession was encouraged by the savings and loan crisis in 1989 as well, though that had a smaller impact on the economy.
On top of that, the Iraqi invasion of Kuwait in 1990 had a powerful effect on the price of crude oil for a little over half a year. The economy already being weak at the time of this event gave it little reason to recover quickly.
The price of gold stayed steady through these events, and kept roughly in line with the prices seen at the end of the 1980s. Gold had found a comfortable price around $350 to $400, and fluctuated around this price until late in the 1990s.
This was the time of the introduction of NAFTA and Bill Clinton, and the economy was running strong in America. Gold loses much of its allure as an investment in times of economic boom, since people would rather earn more by investing in the flourishing economy.
Near the end of the 1990s you can see that prices for gold had dropped some to around $300. Inflation was low in this decade. Inflation rates began the decade at 6% in 1990, then spent the rest of the decade below 3.5%. This is reflected by the starred figures for the 90s showing up in 1998 and 1999.
This concludes another 2 decades in explaining the price of gold. The 1980s had some excitement, with the 1990s being defined by calm and steady sailing for the price of gold.
An overview of gold prices in the 2000s
The 2000s were one of the wildest times in history for the economy.
Even the very first day of the decade was important. At the turn of the millenium, everyone was waiting to see if the Year 2000 computer bug would be as damaging as some people predicted. Computers at the time had only been using the last 2 digits of the year when storing the date. People were worried computers would malfunction in unpredictable ways if some programs read the year incorrectly. Thankfully the planes did not drop from the sky, and the world moved on into a new millenia.
2000s:
2000: $264-325 2001: $256–291* 2002: $277-342 2003: $319-417 2004: $375-454
2005: $411-536 2006: $524-725 2007: $608-841 2008: $712-1011 2009: $810–1212**
Though Y2K was a dud, technology would soon show its wrath. In 2001, the tech bubble burst. In the late 1990s people had began investing in the fledgling internet industry. The problem with that is that many of the businesses that were invested in had bad business models and no clear path to profit. The end result was one of the biggest speculative bubbles in history. The price of tech stocks plummeted, though nearly half of the companies would make it through the crash at lower valuations.
Of course there was also the 9/11 attacks in 2001. These were wholly awful in many ways, with the less obvious consequences of hurting the economy and the insurance industry in particular.
All these factors contributed to a rocky start to the economy in the 2000s, with a recession for 2000-01. At the same time the high point for the price of gold in 2001 fell to a low that had not been seen since the 1970s.
After this, the tables turned. The price of gold started to boom in 2002, and kept going up for many years. By 2005, the price had risen to a level that would fit in with the 1980s. The next year it jumped just above the prices seen anywhere but 1980. This trend continues with 2007 reaching around the same price range as 1980. 2008 and 2009 it broke past that to never before seen highs. It passed $1,000 for the first time ever on Feb 20, 2009.
The rise of gold during this time has many causes. The US had a globally weak dollar at this time, causing investors and funds to move away from it and seek shelter from risk by holding gold. This effect was compounded by strong oil prices and tensions regarding Iran’s aspirations of nuclear armament.
Late in the decade there is also a glaring factor: the 2008 subprime mortgage crisis. This is one of the biggest crisis ever seen in the US economy. The equity and real estate markets were not able to recover for quite awhile. This caused investment dollars to flee into gold and other commodities that suddenly looked much safer.
Another important aspect to the subprime crisis that is less well known to people outside of finance is the quantitative easing (QE) program introduced by the US government. Sometimes called large-scale asset purchases, QE is the act of a central bank buying up assets (such as bonds) from commercial banks and other financial organizations. A central bank undertaking QE will usually offer rates that incentivize the commercial banks with favorable rates. This floods the banks/institutions with money to invest in the economy to stimulate it and provide liquidity and loans. Quantitative easing began in December 2008 and ran into March 2010. It is commonly referred to as QE1 now, though it was not called that at the time.
One factor that was absent from affecting the price of gold at this time was inflation. In the 2000s, the top three inflationary years were 3.4% in 2000 and 2005 and 4.1% in 2007. The average rate of inflation since 1929 has been just over 3%, meaning the highs for inflation in the 2000s was reasonable. The Fed itself promotes 2% as a healthy target for inflation. These statistics makes it clear that investment in gold was not driven by inflation.
All in all, the rise of gold during this decade can be tied to many root causes. Together, they sent the price of gold soaring.
Was gold in an asset bubble though?
How has gold’s price changed in recent years due to economic and geopolitical factors
2010s:
2010: $1058*-1421 2011: $1319-1895** 2012: $1540**-1791 2013: $1195-1693
2014: $1142-1385 2015: $1099-1295 2016: $1074-1363 2017: $1152-1349*
The first months of 2010 continued the quantitative easing that began in 2008, aimed at offsetting the subprime mortgage crisis by pouring $700B into the economy. This caused investment to continue to flow into commodities at a high rate, including gold. The common outlook at this time that the dollar would be devalued further by more quantitative easing.
Gold was at a new high in 2010 and this trend continued further into the decade. The first two years of this decade include new historic highs for the price of gold. To be technical this was still not the highest price gold had reached, when the 1980 gold price is expressed in terms of the modern dollar. On the other hand, the price breaking the $1000 mark and staying above garnered gold a lot of attention.
During gold’s highest year, 2011, we saw the debt ceiling crisis. The US government could not agree on a budget in April and they shut down for a short time. It is easy to grasp that shutdowns have a negative impact on investor confidence in the economy. Another good reason arose for people to park their money in gold. Similarly there were problems with debt in Europe. The causality here is that debt troubles can be read as a signal of incoming inflation. It was not uncommon to see analysts predicting gold moving up above $2000-3000 (which, as we can see in retrospective, never occurred).
Could you call this a bubble? The price did rise from 2009 to 2011, and by more than double. That isn’t a quick rise, but it does fit the part of the definition about the asset rising sharply. The high range of gold ($1560 to $1895) lasted from July 2011 to April 2013. That is rather long, and doesn’t match the bubble analogy too well.
On top of this, the fall of the price of gold was mild. The drop began in October 2012, and the main portion of it was complete in July 2013. Here the price was at $1329. From then to now, the price has fluctuated sideways in a range from $1074-1385. Again, not exactly what you might call the popping of a bubble. Since gold kept a substantial portion of its value after its high point, that is a strong point against it being a bubble.
Some of the fall can be explained by the recovery of equities (such as the S&P500) in late 2012, and investor dollars flowing back to them. As for the rise of the price to its highs, that coincides with the second round of quantitative easing in the US (QE2). As with QE1, the intervention of the government incentivized a move to gold and other commodities. QE2 was announced late in 2010 and it wrapped up by mid 2011, dishing out $600B. Eventually QE3 was also introduced in September 2013, though this was an ongoing monthly program of $40-85B rather than a lump some. It is possible that QE3 softened the fall of gold mildly, though it does not explain the entirety of gold’s gains.
As mentioned earlier, the time after gold’s fall (July 2013 to now) has shown stable prices. Most of this time range, the price has moved within the range of $1100-1300. The last 5 years have been a less exciting time for gold, with a few quick movements. There was a sharp drop of around $100 starting in late October 2015. Another occurred in November 2016, with the price falling around $170. Both of these dips recovered in less than two months. Overall, nothing too significant.
What is next for gold? It’s hard to say. Let’s consider some things that could affect the future price of gold. China comes to mind, along with the global trade negotiations that are currently in full swing. If they dampen the economy or cause large inflation, that could push up the price of gold. Another factor to keep an eye on is the gold buying activity of China, India, Russia, and Turkey. These countries are known for a strong current demand for gold. If they raise or lower these demands, it could influence the price of gold going up or down, respectively.
We hope you enjoyed our history of the American gold standard and the price movements since its dismantling. Follow our Facebook to see other historical and fun posts, or check our blog directly at www.earn2trade.com!