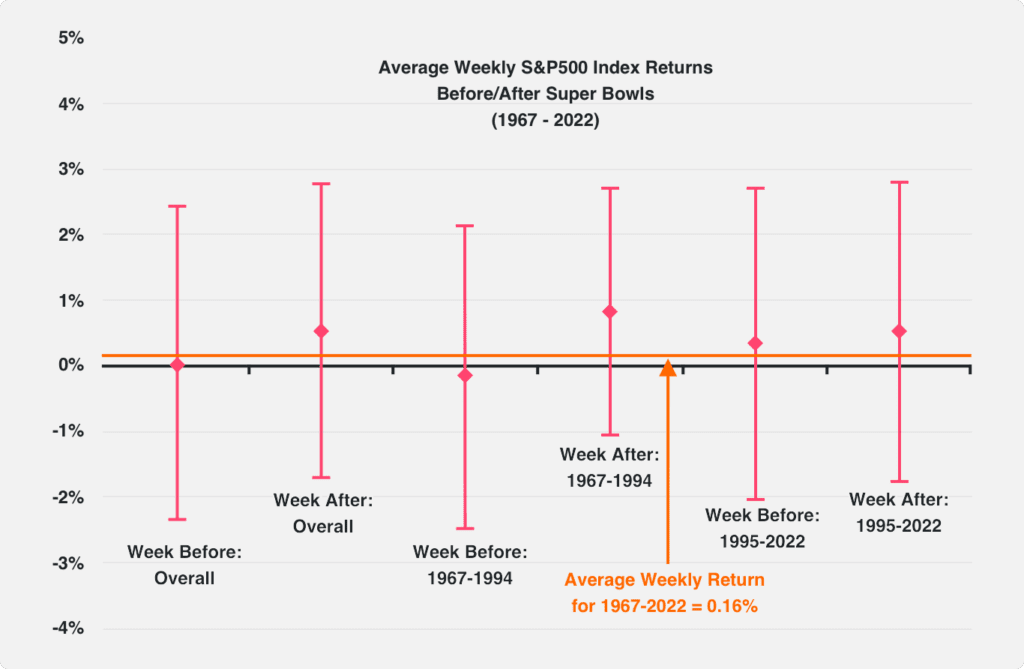
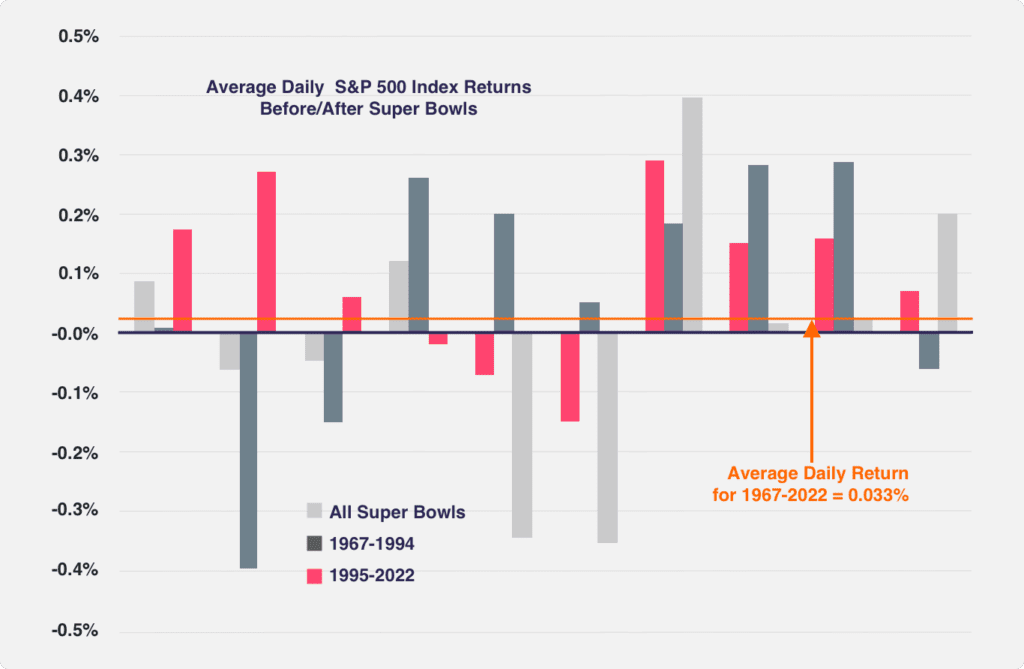
The Super Bowl is the biggest sports event of the year, but did you know it is also a great market predictor? There is a simple but curious pattern known as the Super Bowl Indicator.
The Super Bowl Indicator is a theory suggesting that the direction of the stock market for the following year can be predicted based on the Super Bowl winner. According to the idea, if a team from the National Football Conference (NFC) wins the Super Bowl trophy, the stock market will be bullish that year. But if a team from the American Football Conference (AFC) emerges victorious, the stock market will have a bearish year.
This article will examine the concept and analyze its accuracy in detail.
Who Invented the Super Bowl Indicator?
Leonard Koppett, a New York Times sportswriter, developed the Super Bowl Indicator in 1978. The indicator had shown a consistent level of accuracy at the time. His analysis was based on classifying teams according to the football’s original leagues rather than the conferences they represented during their championship.
How Accurate Is the Super Bowl Indicator?
Since the Super Bowl started, the indicator has been accurate at about 41 out of 54 years. This means the prediction has been correct about 74% of the time.


Between 1967 and 2015, the Super Bowl Indicator was inaccurate only nine times. According to the LPL financial calculations, the S&P has witnessed an average increase of 10.2% in years with an NFC win, while it experiences a 5.8% return when the AFC team wins. The benchmark index has also shown a positive return of 79% in NFC-winning years, compared to 63% for AFC victories.
| Year | Winner | League | Conference | S&P 500 Price Return | Prediction |
| 2022 | Los Angeles Rams | NFL | NFC | -19.44% | Wrong |
| 2021 | Tampa Bay Buccaneers | NFL | NFC | 14.51% | Right |
| 2020 | Kansas City Chiefs | AFL | AFC | 15.76% | Wrong |
| 2019 | New England Patriots | AFL | AFC | 30.43% | Wrong |
| 2018 | Philadelphia Eagles | NFL | NFC | −6.24% | Wrong |
| 2017 | New England Patriots | AFL | AFC | 21.83% | Wrong |
| 2016 | Denver Broncos | AFL | AFC | 11.96% | Wrong |
| 2015 | New England Patriots | AFL | AFC | −0.73% | Right |
| 2014 | Seattle Seahawks | Expansion team | NFC | 13.69% | Right |
| 2013 | Baltimore Ravens | Expansion team | AFC | 32.39% | Wrong |
| 2012 | New York Giants | NFL | NFC | 16.00% | Right |
| 2011 | Green Bay Packers | NFL | NFC | −1.12% | Wrong |
| 2010 | New Orleans Saints | NFL | NFC | 15.06% | Right |
| 2009 | Pittsburgh Steelers | NFL | AFC | 26.46% | Right |
| 2008 | New York Giants | NFL | NFC | −37.00% | Wrong |
Should I Make Investment Decisions Based on the Super Bowl Indicator?
Making investment decisions based on the Super Bowl Indicator is not recommended. This concept is more of an entertaining and lighthearted theory in sports writing than an established trading strategy.
There is no link between the US stock market performance and a football team league. Any correlation between them should be seen as purely coincidental, and just like most things in life, correlation does not equal causation. Therefore, making an investment decision based on this indicator is unwise.
You should only employ evidence-based investment strategies and comprehensive research when making an investment decision.
You may also like: Swing Trading – Definition and Strategies
Takeaway: The Super Bowl Indicator Is Not a Reliable Standalone Indicator
The Super Bowl Indicator is a fun concept that connects the outcome of the Super Bowl to the performance of the stock market. However, there is no accurate relation between the game’s result and the stock market.
It would be best to exercise caution when making any investment decision using this indicator and rely only on evidence-based investment strategies.

