
What time frame is best for day trading is a question asked by many market participants, especially beginners. Whether that is trading on a 15-minute, 5-minute, or 1-minute chart, one should first decide on the overall investing approach he wishes to adopt.
While a trader can only base his trades on a single timeframe, many experienced traders also use multiple time frames to confirm trading signals. In this article, we explore the best day trading time frames and how to benefit from using several time frames at once.

What Is a Day Trading Time Frame?
Time frames directly affect the frequency of your trades, so it is crucial to pick a time frame that is appropriate for your goals and trader profile. In other words, you should first determine what type of trading you will engage in before picking the right time frame. For example, day traders and long-term investors don’t use the same time frames because they follow different trends and trading strategies.
Generally, time frames can be displayed in minutes, hours, days, weeks, months, or even years. If the time frame is smaller, you can expect more trading signals. However, this isn’t always a good thing, as much of this data can be noise that is difficult to filter through and can sometimes negatively affect your trading decisions.
You can switch between different time frames on the chart. The candles represent different time units, depending on your selected time frame.
Since day trading is among the intraday trading types that analyze smaller price movements of just a few minutes to a couple of hours, it usually relies on small time frames such as 15-minute or 5-minute charts.

Common Trading Time Frames
It is quite common to see novice traders struggling to choose a time frame. First of all, it is important to note a couple of things. Usually, longer time frames generate more reliable signals. The reason is that shorter time frames can produce more deceiving signals and noise, making it harder to identify trends and signals.
That said, traders are better off using longer time frames to determine the primary market trend. Once the primary trend is identified, traders can use different time frames to pinpoint short-term movements.
However, picking the right time frame heavily depends on what type of trading you are involved in. This is because swing traders, long-term investors, and day traders use different time frames.
For instance, swing traders analyze daily charts before making a move. They often utilize weekly time frames to identify the primary trend and 60-minute time frames to identify short-term opportunities.
Long-term investors can keep their positions open for several months or even years. They commonly use weekly or monthly charts to identify the primary trend and daily time frames to find optimal entry and exit points.
What Is the Best Time Frame for Day Trading?
Day traders focus on smaller price moves within a single trading day. While they often utilize margin trading and leverage to increase their profit potential, day traders can usually choose between several different time frames. However, it depends on how long they plan to keep their position open during a trading day.
In day trading, the aim is to take advantage of price movements over a period of a few minutes to several hours, assuming that all positions must be closed by the end of the trading day. This is why day traders generally use smaller time frames. Good examples of commonly used time frames in day trading include 1, 5, 15, 30, and 60-minute charts.
Remember, choosing a trading frame that suits your strategy and trading profile is crucial. This is why practicing using different time frames in demo trading is highly recommended before making real trades.
Scalpers looking to make a profit measured in a few pips typically use 1-minute or 5-minute charts. In essence, their strategy is based on the belief that it is better to record several trades during the day and make small, consistent gains instead of single one-off wins. This is why they also tend to place a narrow stop loss to protect their accounts while also moving fast to close their winning trades.
Trading On a 15-Minute Chart
A 15-minute time frame is commonly used by day traders who carry out several trades within a single day. Because they have a wider watchlist, they need a somewhat longer time frame to help them scan and analyze price movements in the best possible way. In this case, a shorter time frame would contain a lot of noise and make it harder for a trader to refine entry points.
For some day traders, a 15-minute chart is a preferred choice for identifying intraday patterns and detecting key entry points. This time frame provides traders with proper insight into support and resistance levels and allows them to cash in on major intraday price movements.
As noted earlier, trading on the 15-minute chart is one of the most common day trading strategies.
Trading On a 5-Minute Chart
The chart allows day traders to trade around price reversals and keep their positions open when a new trend emerges. This approach is common among traders focused on trading short-term momentum shifts.
Both 15-minute and 5-minute charts are used by traditional day traders, who aim to make just a few trades per day. When choosing between the two, it largely comes down to your trading strategy.
1-Minute Time Frame Trading
They are mainly used by experienced scalpers. As explained earlier, scalping is a trading method that attempts to cash in on multiple small price changes.
This time frame requires a thorough understanding of the market structure and strict trading discipline. Trading with 1-minute charts requires a well-established exit strategy and lots of information.
Trading in this time frame demands constant attention because new candlesticks are generated each minute, and fresh trade signals can emerge anytime. Since new candles/bars are produced so often, 1-minute chart traders usually make many transactions, compared to those who use 5-minute or 15-minute time frames.
Trading On Multiple Time Frames
In trading, making money is all about identifying a trend and planning your trades around it. Market trends are usually categorized as primary, intermediate, and short-term. But markets exist in multiple time frames at the same time, and because of this, price trends for a particular security can sometimes conflict with each other, depending on the time frame.
Example of Using Multiple Time Frames
It is common for traders to use a longer time frame to identify the primary trend, an intermediate time frame to look for signals, and a shorter time frame to pinpoint entry and exit points.
For example, below is a 1-hour AAPL chart. We start by identifying the dominant trend, which in this case is an uptrend, given the tendency of higher lows and higher highs.

After identifying that the price action is moving in an uptrend, we will use the 15-minute chart to define our entry point. Our day trading strategy is based on the following principle: we will look to buy a stock moving in an uptrend as soon as there’s a correction in price action that pushes the price toward the 200 moving average (the red line) on the 15-minute chart.
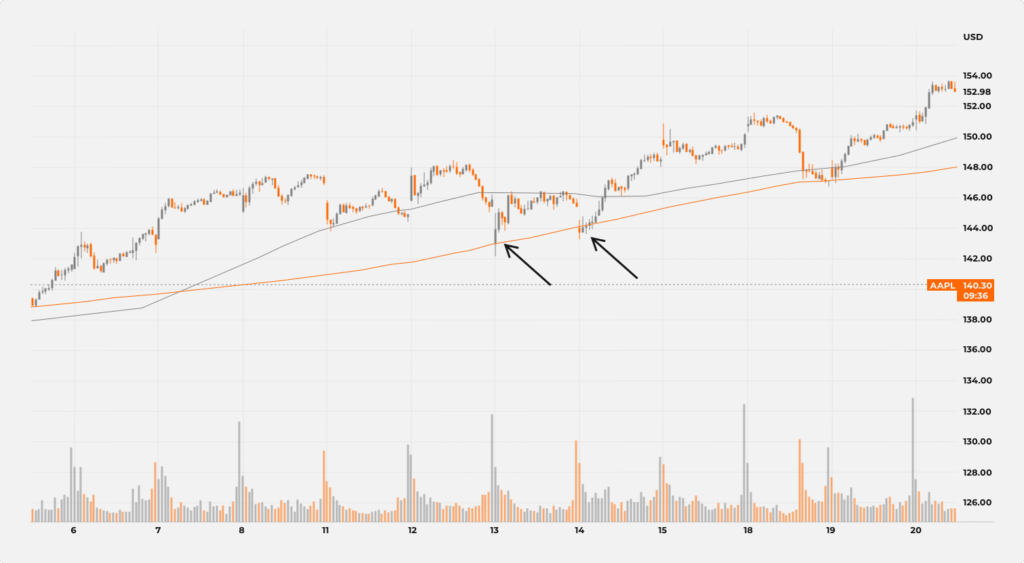
Within one trading day, our strategy yielded two buy trades. In both cases, the price action fell to the 200 moving average before spiking higher. The stop loss should be placed several pips below the moving average, while our take profit level should be somewhere double the number of pips we are risking.
For instance, if our stop loss is ten pips below the entry point, we are attempting to make at least 20 pips to make our strategy profitable in the long term. In both cases, our take profit targets were hit, resulting in an estimated 40 pips profit for a single day.
Conclusion
Choosing the best time frame for day trading activities depends on what type of trader you are. Those retail investors looking to make smaller profits per trade while executing several trades per day will usually go for a 5-minute or 15-minute chart.
On the other hand, traders who are laser-focused on nailing a one, low-risk trade during a single day-trading session are more likely to use a 30-minute or 1-hour chart. More experienced traders prefer using multiple time frames to confirm trading signals and identify trade levels (entry point, take profit, and stop loss).
The selection of time frames represents a unique choice for each trader. As a general rule of thumb, traders should choose the primary time frame they want to use and then complement it with additional time frames.