A significant mistake that inexperienced traders often make is to analyze an instrument’s average price based only on its closing value. But for traders and long-term investors who want to get a clear picture of the stock’s health, there is more to it. That is why they look for a tool that can help them identify the traded instrument’s actual average price by taking trading volume into account. The Volume Weighted Average Price (VWAP) is one of the best instruments for a fair representation of the traded instrument’s quality.
This guide will focus on a VWAP example to better understand the indicator and learn how it can improve your trading decisions. We will also examine the VWAP calculation process and determine who comes out on top in the VWAP vs. WVMA comparison. Let’s dive in!

What is The Volume Weighted Average Price (VWAP)?
The VWAP is a trading tool that considers both volume and pricing information to come up with a complete representation of the average price a security has traded at throughout the trading session.
The Volume Weighted Average Price serves as a benchmark for market participants looking to get a clear and detailed picture of a particular investment or trading opportunity quality. What makes VWAP stand out is that it reflects the stock’s real average price based on the volume of transactions, instead of just closing. The VWAP is so essential because it gives market participants insights about the trend and the value of the traded security.
Due to all this, it has become a prevalent tool for everyone involved in buying and selling financial instruments. Today, day traders, speculators, and large-scale investors like pension funds and mutual funds all use the VWAP indicator.
On a chart, the VWAP is displayed as a moving average but is much slower than the typical 8 or 20-day MA.

You might also enjoy:
- The Rising Wedge (Or Ascending Wedge) – All you Need to Know About It
- What Happens After You Get Funded with Earn2Trade? A Complete Guide
VWAP Calculation and Formula
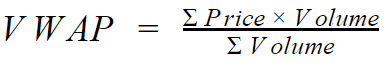
The simplified formula to calculate the Volume Weighted Average Price looks like this:
There is also a more “academic” version that we can present in the following way:
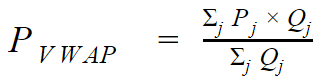
Where:
PVWAP – Volume Weighted Average Price
Pj – Price for trade j
Qj – Quantity for trade j
j – each individual trade taking place during the defined period
In the end, both formulas do the same thing – they take the number of shares bought and multiply it by the share price. Then the number is divided by the total shares bought. The result is the value for the VWAP. It represents the stock’s average price based on the number of shares traded at different prices throughout the trading session.
The time frame the calculation is made for is a single day.
Nowadays, traders rarely, if ever, calculate indicators by hand, so there is no need to worry about the process. The most important thing is to understand how the formula works to interpret the results better.
Once you are aware of this, you can simply add the VWAP indicator to the chart, and it will automatically make the needed calculations to give you the Volume Weighted Average Price.
How Can The Indicator Help You?
The short answer is: by giving you an accurate representation of the traded instrument’s actual price.
Market participants who consider only the instrument’s closing price fail to acknowledge the role volume plays in the process. As a result, they may fail to realize the effect this has on the general trend.
For example – did the stock hit a new low with low trading volume? Or did it close at a high with low volume?
The additional context the VWAP provides allows the trader to make more informed decisions and better project the strength of the traded instrument’s trend and health.
Day traders and speculators use the VWAP to evaluate how good the momentum is for buying and selling. They build strategies around the VWAP and often employ it as a confirmation tool but mostly for trades that last from a few minutes to no more than a couple of hours. The most popular scenario is going long when the price ranges above the VWAP and going short when it is below it.
Day traders also have a rule of thumb that protects their positions from whipsaw effects in price. For example, if the VWAP line is flat, but the price has made a quick up or down move, the most likely scenario will revert to the VWAP line. On the other hand, if the VWAP line is getting steeper along with the trend, counter-trend positions aren’t advisable.
Large-scale investors and more passive market participants like pension funds and mutual funds use the indicator to predict better when to move into or out of a trade with as little market impact as possible. Alternatively, to avoid affecting the market for the particular instrument. To do that, large-scale investors usually sell above the VWAP and buy below it. That way, the price is pushed to its average, rather than away from it.
VWAP Examples
The most widely-spread and easiest way to use the VWAP is very similar to the interpretation of moving averages. Prices ranging above the VWAP reflect a bullish sentiment, while those below the ratio’s line indicate a bearish one.
In the example below, the VWAP is the green line. There are two situations (red and green squares) where the price ranges below or above the indicator’s line.
The simplest scenario to trade is to wait for a crossover and:
- Sell once a bearish candle closes below the VWAP;
- Buy once a bullish candle closes above the VWAP.

This simple strategy allows traders to protect themselves from potential price whipsaws. We can also supplement it with support and resistance.
The consensus among traders and long-term investors using the VWAP is that if the price hovers below the instrument, the instrument is “cheap,” while when above it, it is “of value.” However, one should only use this type of analysis on an intraday basis and in the context of the general state of the security and its recent performance. It isn’t indicative of long-term performance or for the identification of stable trends.
Alternatively, if the instrument was bought below the VWAP line or sold above it at the end of the day, the trades are considered worth it, and the price was better than average.
The Difference Between VWAP and Other Moving Averages
Popular indicators like moving averages come in many forms. Most of them have in common that they employ the principle of smoothing the prices by taking their average to serve traders as a benchmark for the past and potential future performance of the particular security.
What most of them fail to acknowledge, however, is how essential trading volume is for the wellbeing of markets nowadays. In reality, it is among the most critical characteristics traders look at when planning their next moves. Things like whether the volume is low or high, how long it has been so, or if there have been some recent spikes are crucial for day traders, long-term investors, and large-scale funds as they indicate the market’s stability and the reliability of the trend.
The VWAP indicator improves upon conventional moving averages by factoring the trading volume in the price to provide market participants with a better and more complete benchmark. Its calculations are based only on new information, relevant for the current market session, and don’t consider past data that might be outdated.
VWAP vs. Simple Moving Average
When plotted on a chart for the untrained eye, the volume-weighted average price might not look any different from the simple moving average. In the example below, you can see the VWAP (green) and the SMA (blue) plotted on a 5-minute chart for the E-Mini S&P 500.

Even before getting into details about how both indicators differ, the chart alone shows how the SMA is much more volatile when it comes to intraday prices, while the VWAP is way flatter.
Aside from this, the truth is that the indicators provide different information. Here are the key differences between the VWAP and the SMA to help you better distinguish both indicators:
| VWAP | Simple Moving Average | |
| Calculation | The sum of the prices, multiplied by the volume and then divided by the total volume | The sum of the closing prices, divided by the number of trading periods |
| Volume | Factored in | Not factored in |
| Market Impact | Helps reduce it | Can’t help to reduce it |
| Data Included | Starts fresh | Includes past data |
| Emphasis | On volume-weighted current prices | On past data |
| Trend reflection | Short-term trends | Long-term trends |
| Response to current trends | Quick and adequate | Slower to respond |
| Intraday suitability | Suitable for intraday trades | Gets more volatile when used intraday |
| Ideal for | Short-term traders | Long-term traders |
The above is not proof that the VWAP is undisputedly the better indicator than the SMA for any given market circumstance. However, considering how financial markets have evolved during the last few decades, today factoring current trading volume dynamics and not relying so much on past data is even more critical than ever.
VWAP vs. VWMA
The volume-weighted Moving Average (VWMA) is an MA that considers the trading activity for the given time frame to emphasize the effect of volume on prices. The VWMA puts more weight on prices with high trading activity. On the other hand, prices surrounded by less trading volume receive lower weight.
The lower weight is beneficial because it helps identify stable trends and reliable momentum opportunities. Although the VWMA is a way more complete indicator than the SMA, both are close in value during periods of low market volume.
We can use the VWMA for several purposes, including discovering emerging trends, confirming existing ones, or identifying upcoming market reversals. And this is precisely one of the core things that make it different from the VWAP. However, there are many other differences between both indicators, starting with the fact that the VWMA is an “updated” Moving Average and traders often use it in addition to an SMA.
In a nutshell, the VWAP is cumulative of the average price in relation to volume. Its calculation begins at the start of each trading session, and it doesn’t drop any data over time. Instead of the bar’s close, it uses the typical price, as in the sum of the low, close, and high prices, divided by three.
On the other hand, the VWMA uses fixed periods that allow it to drop older data. Its calculation is continuous and spans across several sessions, unlike the VWAP, which is reset at the start of every period.
Both indicators aren’t mutually exclusive. Just the opposite – you can use them to complement your short- and long-term trading strategies based on your goals and trading style.
Advantages and Disadvantages
VWAP has plenty of advantages. Like any other technical trading tool, however, it isn’t flawless and has some drawbacks. That is why it is essential for everybody interested in using it to get familiar with them before jumping into real trading.
Here is a quick summary of the VWAP’s pros and cons:
| Advantages | Disadvantages |
| Factors in the trading volume | Requires a vast amount of data to provide an accurate picture |
| Helps spot lows and highs to buy and sell | Doesn’t take historical data into account |
| Can signal changes in market sentiment | Reliable only as a single-day indicator |
| Helps capture the perfect moment to get into a trade in relation to liquidity, transaction costs, and best execution | May lead to missed opportunities in strong trends (if waiting for the price to drop/rise below/above the line), if not complemented with additional indicators |
| Useful for retail traders and large-scale investors | When fed with too much data, the VWAP line can experience lags throughout the trading session |
| A building block for many trading algorithms | Isn’t so reliable when used on longer time frames (better to use it on 1- or 5-minutes charts) |
| Can be used as a dynamic support and resistance | |
| Helps reduce the market impact of large-scale traders |
Final Thoughts
Mastering the VWAP won’t happen overnight, but it indeed is worth it, considering how important it is for traders to have the complete picture and the best prerequisites to make an informed decision. And the volume-weighted average price indicator provides just that – it is capable of simplifying your decision-making trading process and further enhancing your strategy.
Using the VWAP, traders can ensure they are paying a fair price, remain capable of spotting momentum opportunities, and getting a more balanced representation of the market’s strength. However, it isn’t flawless, and you shouldn’t base your whole trading strategy on it. Make sure to complement it with additional indicators to guarantee you are ensuring the market’s perfect timing.