
Active traders can’t juggle the sheer statistics and data that make up a day’s trading activity. It isn’t practical, and in many situations – possible, even for the most mathematically inclined among us. A trading journal fills the gap between trading and analyzing and serves as a critical part of any serious trader’s journey.

What Is a Trading Journal?
A trading journal can take many forms, but the fundamental similarity is that they basically gather records of your trades over time that can be analyzed later. These journals are critical in developing and improving trading styles, assessing different techniques, and seeing your progress as you move forward in your trading journey.

Why Use a Trading Journal?
Inexperienced or novice traders often deem trading journals unnecessary – after all, nearly every brokerage or trading platform collects records of your trading history. Because of this, some assume that the time required for reentering trades in a journal could be better spent researching, planning for the next day’s trade, or enjoying the fruits of your trading labor.
However, ask any professional, and they would say that the importance of trading journals can’t be overstated. Keeping a trading journal helps in two main aspects, including:
Strategic Management
Getting a long-term perspective of your portfolio, trades, and P&L is critical in assessing the viability of your strategy.
Trading journals also help plan your trades. You can automate many functions, like stop-loss and order size calculations, and use the trading journal as a real-time planner to set the structure of a trade without pecking away at a calculator or guesstimating and missing the mark.
When you have an exhaustive journal, you can also nail down variables that impact your strategy to manage those inputs better and constantly adapt and improve your technique. For example, in-depth journaling could yield insight that your system is more successful on days when a particular benchmark is up or down, specific days or times that are better, or whether your stop loss orders are too broad or tight. Since trading is fundamentally shifting statistics in your favor, finding the data that can improve your strategy by even 1% can make a huge difference.
Emotions Management
Frankly, 90% of trading is mental modeling, while strategic management and actual trades make up the rest. The best strategy in the world won’t mean much if you don’t follow it. By putting a plan down on paper (metaphorically) and keeping yourself accountable through journaling, you can short-circuit the lizard part of your brain that might panic and blow a potentially-successful trade or end up losing you money.
On the other hand, journaling can help break the sunk cost mentality or gambler’s fallacy. If you spend a ton of time developing what you think is a winning strategy, you might have trouble admitting defeat if it isn’t working out. By journaling, you can pin down precisely whether it’s working and where it succeeds and fails. By serving as an objective, indisputable assessment of your strategy, journaling helps control your emotions. Trading is stressful enough, so journaling is critical to offload some of the emotional debt you’re accruing.
How to Make a Trading Journal Using Excel
While there are various browser-based and downloadable trading journal software options, Excel is a great tool that new and experienced traders can take advantage of. With basic program literacy, you can comprehensively log and chart your trade history and draw deep analytical insight from that data. And all that is essentially for free if you have the Microsoft Office Suite. Using Excel will save you costs from paying for SaaS solutions or save the hassle of scrawling trades in a notebook.
Because of the high degree of variability, there isn’t often a one-size-fits-all solution for traders developing an Excel trading journal.
Below, we’ll look at some core tenets you might want to include in a journal. We’ll examine a basic Excel-based trading journal for a pre-market gap strategy that is also stock-centric. Still, the core fundamentals apply to most asset classes, including crypto, futures, and similar equities.
However, remember that your variables and inputs are ultimately dictated by your Excel understanding, trading methodology, and strategy. If you don’t use Excel, you can also consider Google Sheets or OpenOffice.
Basic Layout
Structurally, you’ll likely want at least two sheets in the workbook: one for actual data logging and one for trade analysis. Some traders like using a third sheet with screenshots of charts, but this tends to create a massive file that can be critically damaging if you’re running a resource-intensive trading platform.
The first sheet consists of historical trades, listed (by default) by date. You’ll want to make each column sortable, so you can quickly rack and stack your specific strategy variables. The second sheet will build upon the first and draw data from that log to create graphs and analytics to help assess your strategy. Here’s what those two sheets could look like:
Sheet 1
| Date | Ticker | ATR | Prev. Close | PM High | AH Change | Type | Entry | Entry Time | SL | Exit | R |
| Oct.28.21 | |||||||||||
| LCID | $1.63 | $27.01 | $28.60 | 6% | Long | $28.923 | 9:37 | $28.60 | $29.561 | 1.98 | |
| F | $0.48 | $15.53 | $17.24 | 11% | Long | $17.549 | 9:43 | $17.24 | $17.230 | -1.03 | |
| BUD | $0.91 | $57.21 | $63.80 | 12% | Long | $64.068 | 10:23 | $63.82 | $63.740 | -1.32 | |
| Oct.29.21 | |||||||||||
| LCID | $2.43 | $35.44 | $38.78 | 9% | Long | $39.680 | 9:37 | $38.79 | $40.430 | 0.84 | |
| LCID | $2.43 | $35.44 | $38.78 | 9% | Long | $40.363 | 9:38 | $39.52 | $39.500 | -1.02 | |
| X | $1.11 | $23.43 | $26.19 | 12% | Long | $26.728 | 9:37 | $26.21 | $26.220 | -0.98 | |
| LCID | $2.43 | $35.44 | $38.78 | 9% | Long | $37.739 | 10:33 | $36.96 | $36.910 | -1.06 | |
| X | $1.11 | $23.43 | $26.19 | 12% | Long | $26.508 | 10:42 | $26.26 | $26.760 | 1.02 |
Sheet 2
| Total Trades | 184 |
| Average Trade/Day | 8.761904762 |
| Average Trade/Week | 43.80952381 |
| Weekly Expected $ | $1599.04762 |
| EV | 0.730 |
| Trades/Week | 43.8095238 |
| Risk/Trade | 50 |
Data to Include
Let’s break the first sheet down. The trader’s strategy in the example is driven by pre-market gaps (a momentum-style system), which is why there are some specific variables (e.g., the ATR). However, many of the data points you will see below are standard across all Excel-based trading journals.
Some of these data points are self-explanatory, but still, let’s go through each column:
- Date: lets the trader track progression over time or break it down by a specific period.
- Ticker: the trader must know what he’s trading, so having the ticker or asset name is critical.
- ATR: part of this user’s screening criteria is the average true range, which they use to determine the best range for their strategy over time.
- Previous close, pre-market high, and after-hours change percentage: because the gap strategy relies on big moves outside market hours, these variables help the trader see what minimum or range of percentage change is best. He can also track what stock price range works best, i.e., whether small caps like IONQ outperforms blue chips like AAPL or MSFT.
- Long/short: the trader’s signals include whether to go long or short the stock.
- Entry, time, stop-loss, and exit: these are essentially mandatory in a journal, no matter the strategy or asset class.
- R: this trader, rather than assessing trades based on strict P&L, determines success as a function of units of risk R. The mechanics of using risk units to evaluate performance are beyond the scope of this article, but units of risk are usually more objective and scale better than using currency value as a benchmark.
Using Formulas
The data we used is fine on its own, but its use is limited without basic analytics. For this, we need to automate our journal with formulas. This is where the second sheet comes into play, although a few formulas can also be found on the first:
- Automatic R calculations that divide the difference between exit price and entry by the difference in entry and stop loss.
| Type | Entry | Entry Time | SL | Exit | R |
| Long | $28.923 | 9:37 | $28.60 | $29.561 | =(L3-H3)/(H3-K3) |
| Long | $17.549 | 9:43 | $17.24 | $17.230 | -1.03 |
| Long | $64.068 | 10:23 | $63.82 | $63.740 | -1.32 |
- Basic addition of trades per day and R per week to serve as a quick reference point.
- On sheet two, we take advantage of Excel’s automation and analytic tools with formulas.
This section of the trader’s journal is his equivalent to P/L and helps predict future profits. The expected value, calculated by averaging success probabilities through R, shows the success rate of the strategy. With the expected value, one is equivalent to a successful strategy that hits 100% of the time.
Since we’re working with probability, anything over 0.51 means that the strategy will be profitable over time, although the higher, the better. After the expected value, the trader’s journal shows the total trades, which are averaged per day by dividing total trades by total days traded, then averaged per week by multiplying by five (trading days).
Then, our weekly expected income calculator helps predict total cash flow based on the strategy’s averages:
| WK Expected $: | 1599.04762 | =C12*C13*C14 |
| EV | 0.730 | =B2 |
| Trades/WK | 43.8095238 | =B9 |
| Risk/Trade | 50 |
The expected value and weekly trades are pulled from the previous cells. The risk per trade is a dollar value representing how much cash is on the line if the stop loss is activated. This, multiplied by EV and trades per week, gives a rough indicator of how much money might come in weekly.
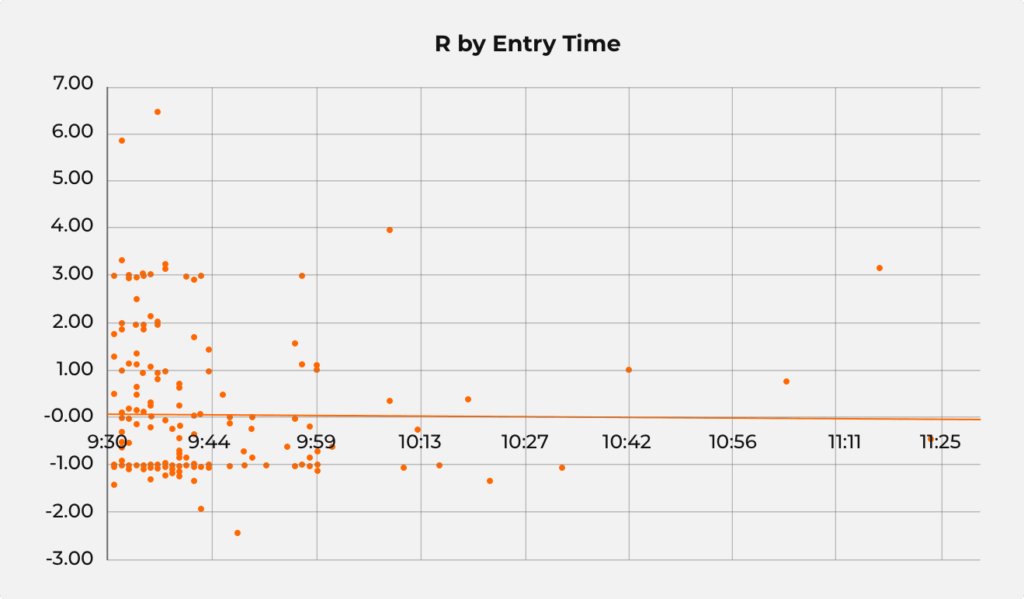
This trader is visually-oriented, so he also uses various Excel-generated graphs and charts. We won’t dive into the details of building charts, but rest assured that it is a simple and easy analytics tool if you’re willing to play around with the variables.
How to Keep a Trading Journal
Starting and keeping a trading journal can be a long process at first, especially if you aren’t Excel-savvy. If you decide to give it a go, however, don’t forget that to be efficient, your trading journal should be a living document that you adapt, tweak, and adjust over time.
It takes time, but ensure you spend the hours after you’re done trading to plug in the day’s data. It’s best to analyze in detail after a while, which is why many traders do end-of-week, end-of-month, quarterly, and annual deep dives into their journals and strategy.
Remember – the law of large numbers dictates that an accurate average is only derived from many trades, so make sure to add data to your trading journal consistently. Only that way can you accurately determine how efficient your trading strategy is.
Conclusion
Trading journals are a mandatory tool in your arsenal, regardless of your experience level, strategy, or preferred asset class. It can give you invaluable insights you can’t get otherwise while also helping you become a more disciplined trader.